Left panel
Basic functions related to network analysis
Once you decide the details of your own network, the network visualization page will show up for basic analysis purpose as below.
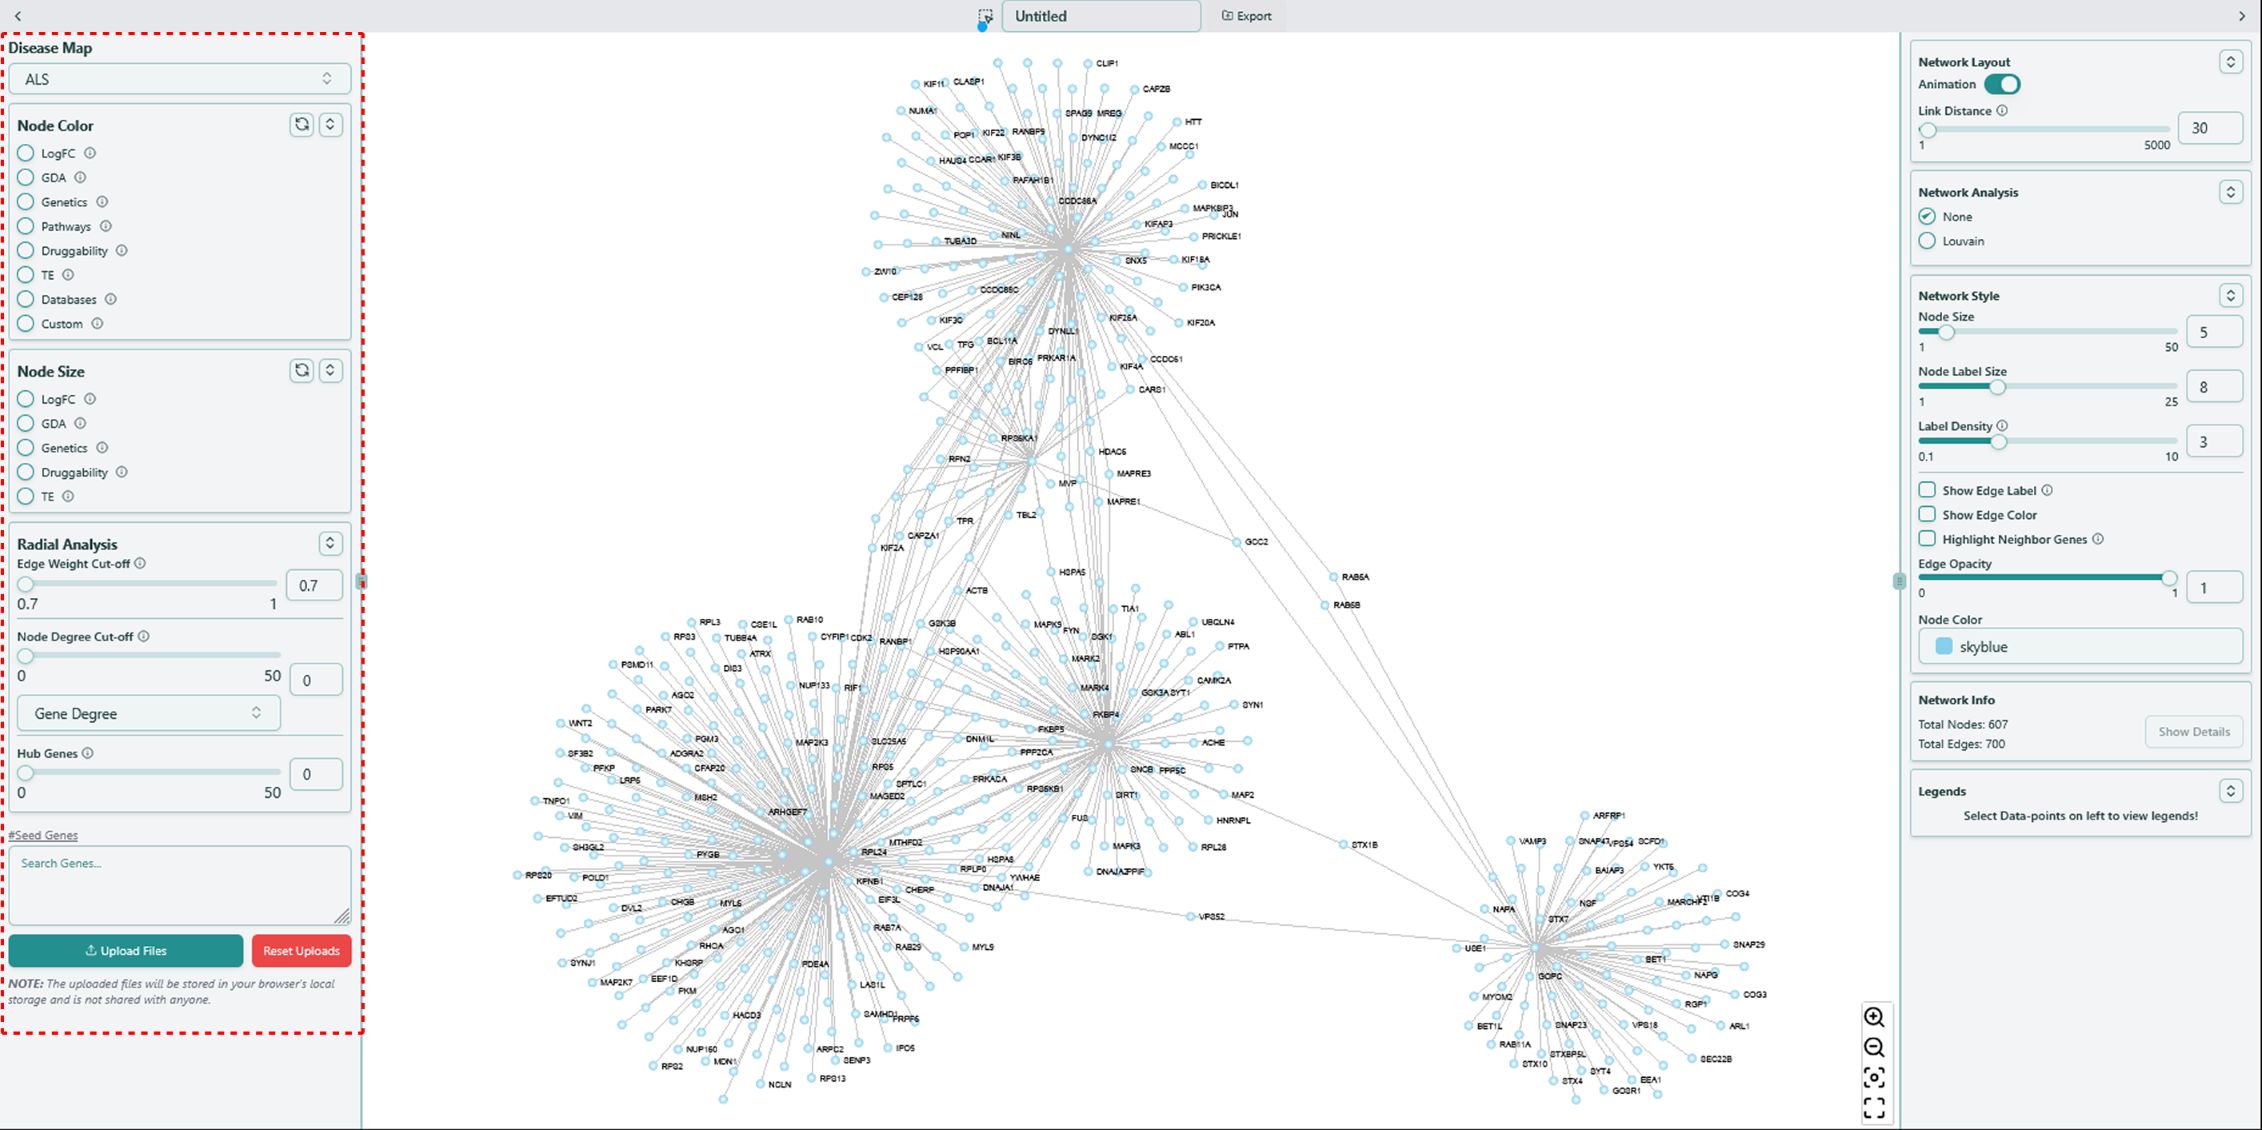 Left panel of network visualization page
Before going over the functions on the left panel, you might want to have some basic understandings of the data available in our tool.
Knowledge Base integrated in our tool is build based on disease-dependent data and disease-independent data. Disease-dependent data indicates the data of specific features varies based on different diseases, while disease-independent data indicates the data remains the same once the disease changes.
Disease-dependent data includes LogFC, GDAand Genetics, while disease-independent data includes Target Prioritization Factors, Pathway, Druggability, Tissue Enrichment. We also call these data types as features.
Disease Map
Sometimes you may want to switch to another disease after generating the network visualization, no need to go back to the Dashboard to change the disease and re-render the network, here is a simple way to do it:
- Locate Disease Map on the top of the left panel and select the disease name that you want to switch to. You can hover on the info icon to check the full name of the selected disease.
- Please note that only the disease-dependent data will change if you switch to another disease.
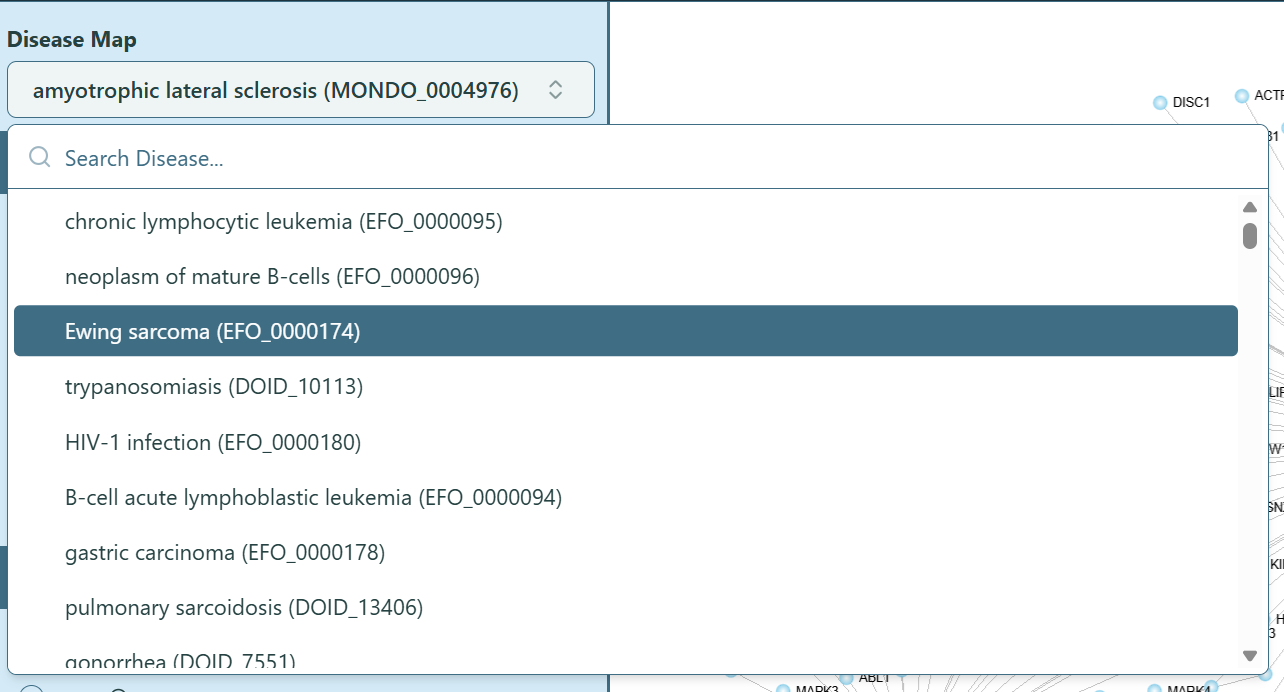 Disease Map
Change Node Color
You can change the node color by selecting different features.
- Choose a feature.
Note: You can hover on the info icon
 to check the explanation.
 - Select the preferred option for that feature in the dropdown list. You can type the keyword in the search bar to help locate the data name.
Note: You can check the Legends section on the Right panel to get the legend of each feature.
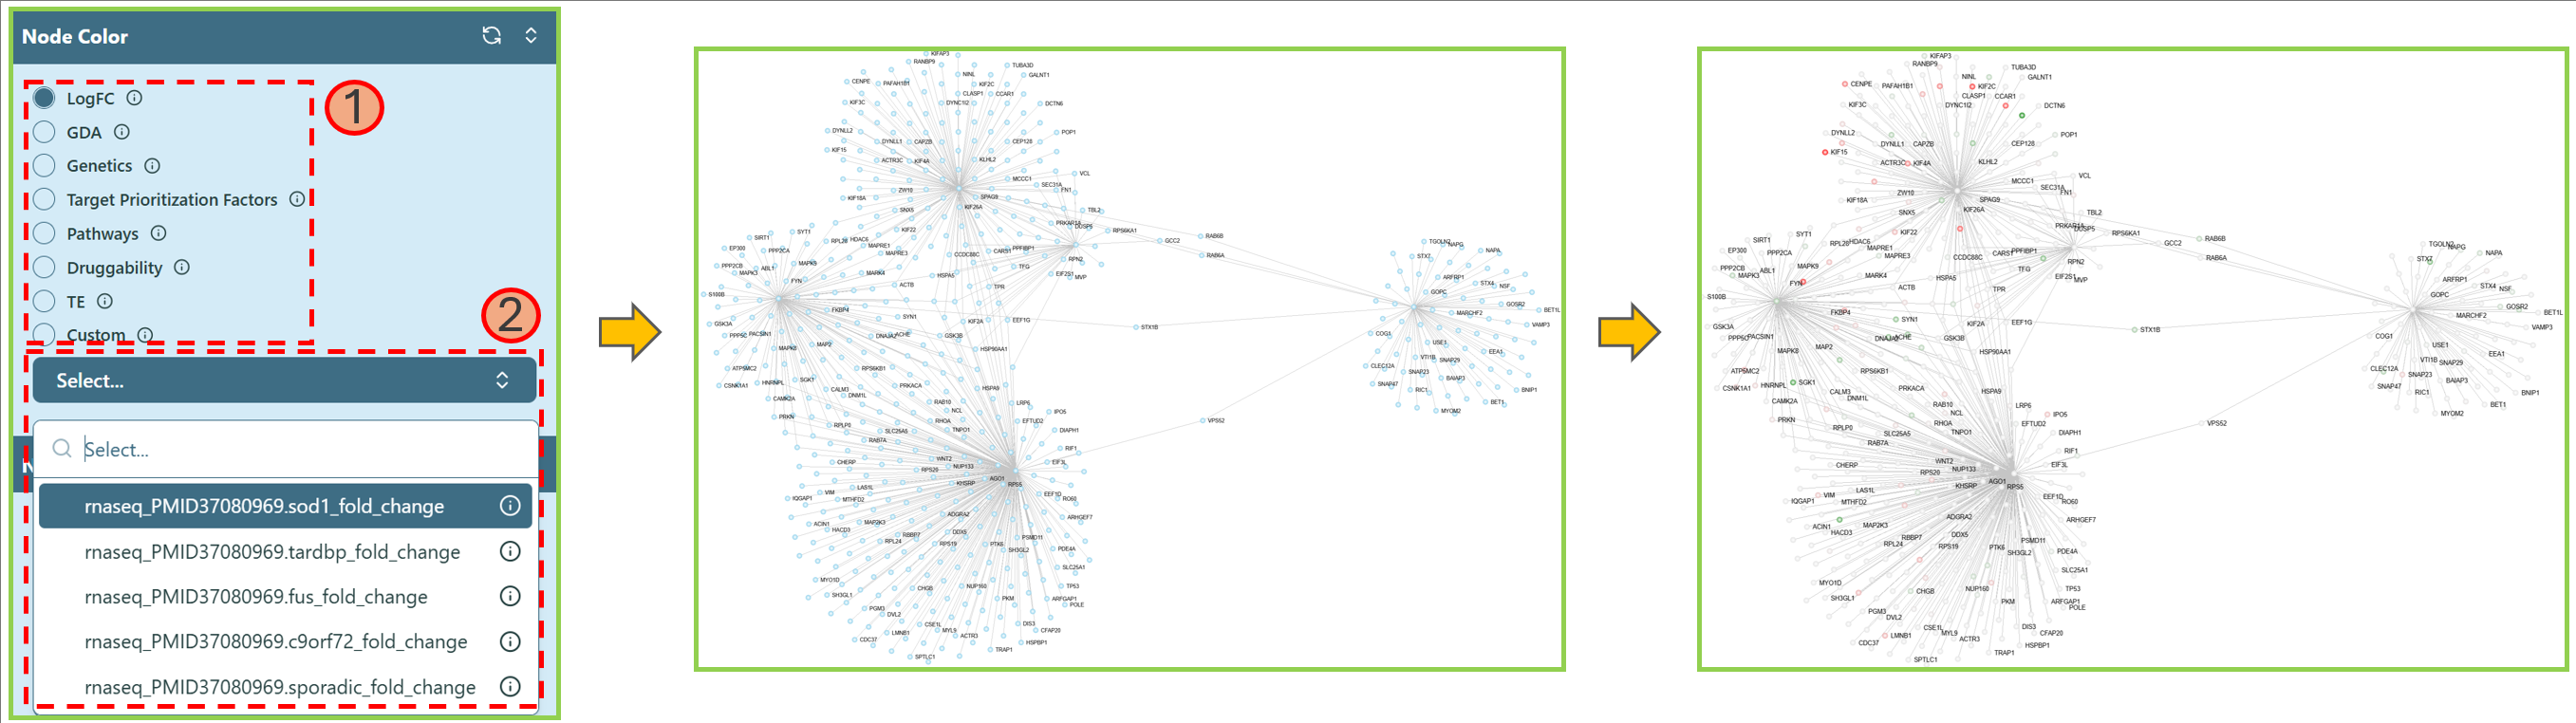 Change node color
Change Node Size
You can change the node size by selecting a feature.
- Choose a feature.
Note: You can hover on the info icon
to check the explanation. - Select the preferred data for that feature in the dropdown list. You can type the keyword in the search bar to help locate the data name.
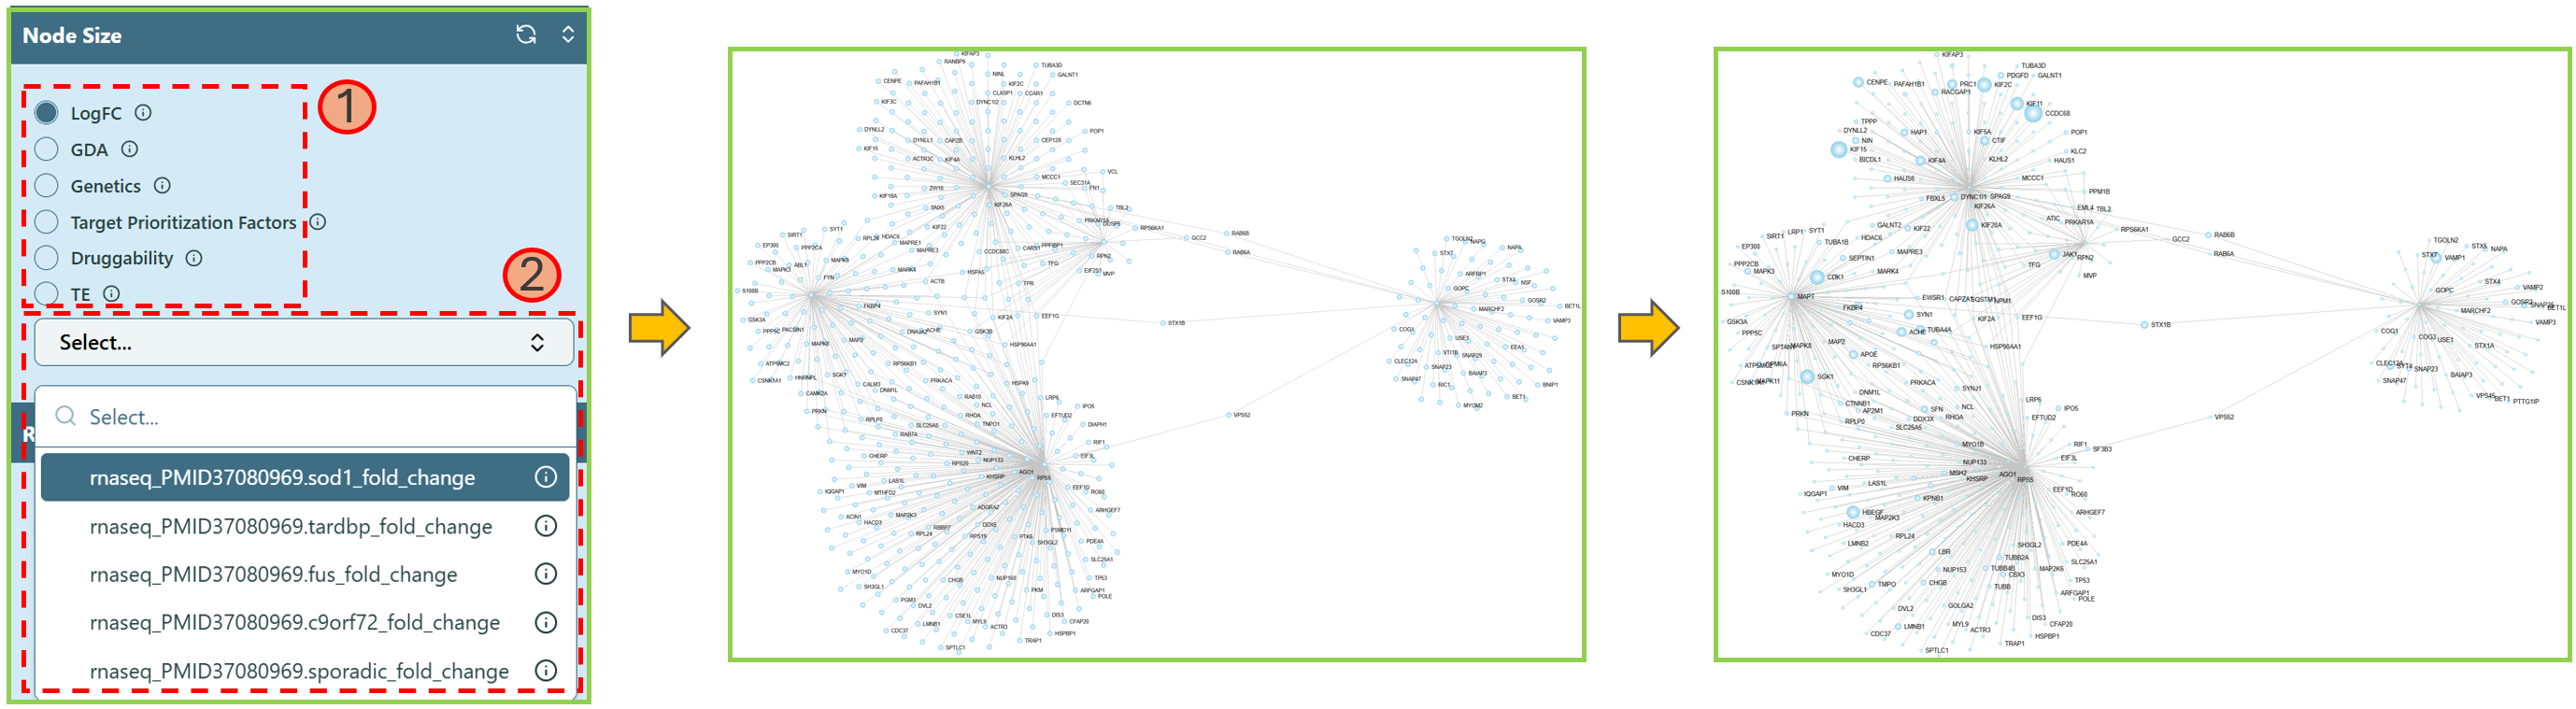 Change node size
We provide less features in Node Size section simply because the feature Pathways is binary features — either a gene exists in a pathway or it does not exist. However, to change the node size in a network, we need consistent data instead of the binary data.
Combination of both Node Color and Node Size Change
Node color and node size can be both changed at the same time to highlight the corresponding genes, making them clearer.
 Change both node color and node size
Radial Analysis
- Edge Weight Cut-off
This feature allows you to filter out the nodes with less edge weight, so that you can focus more on the clustered nodes.
- Use the range slider or directly type in the number to select an appropriate value and filter out the nodes with edge weight less than the selected value.
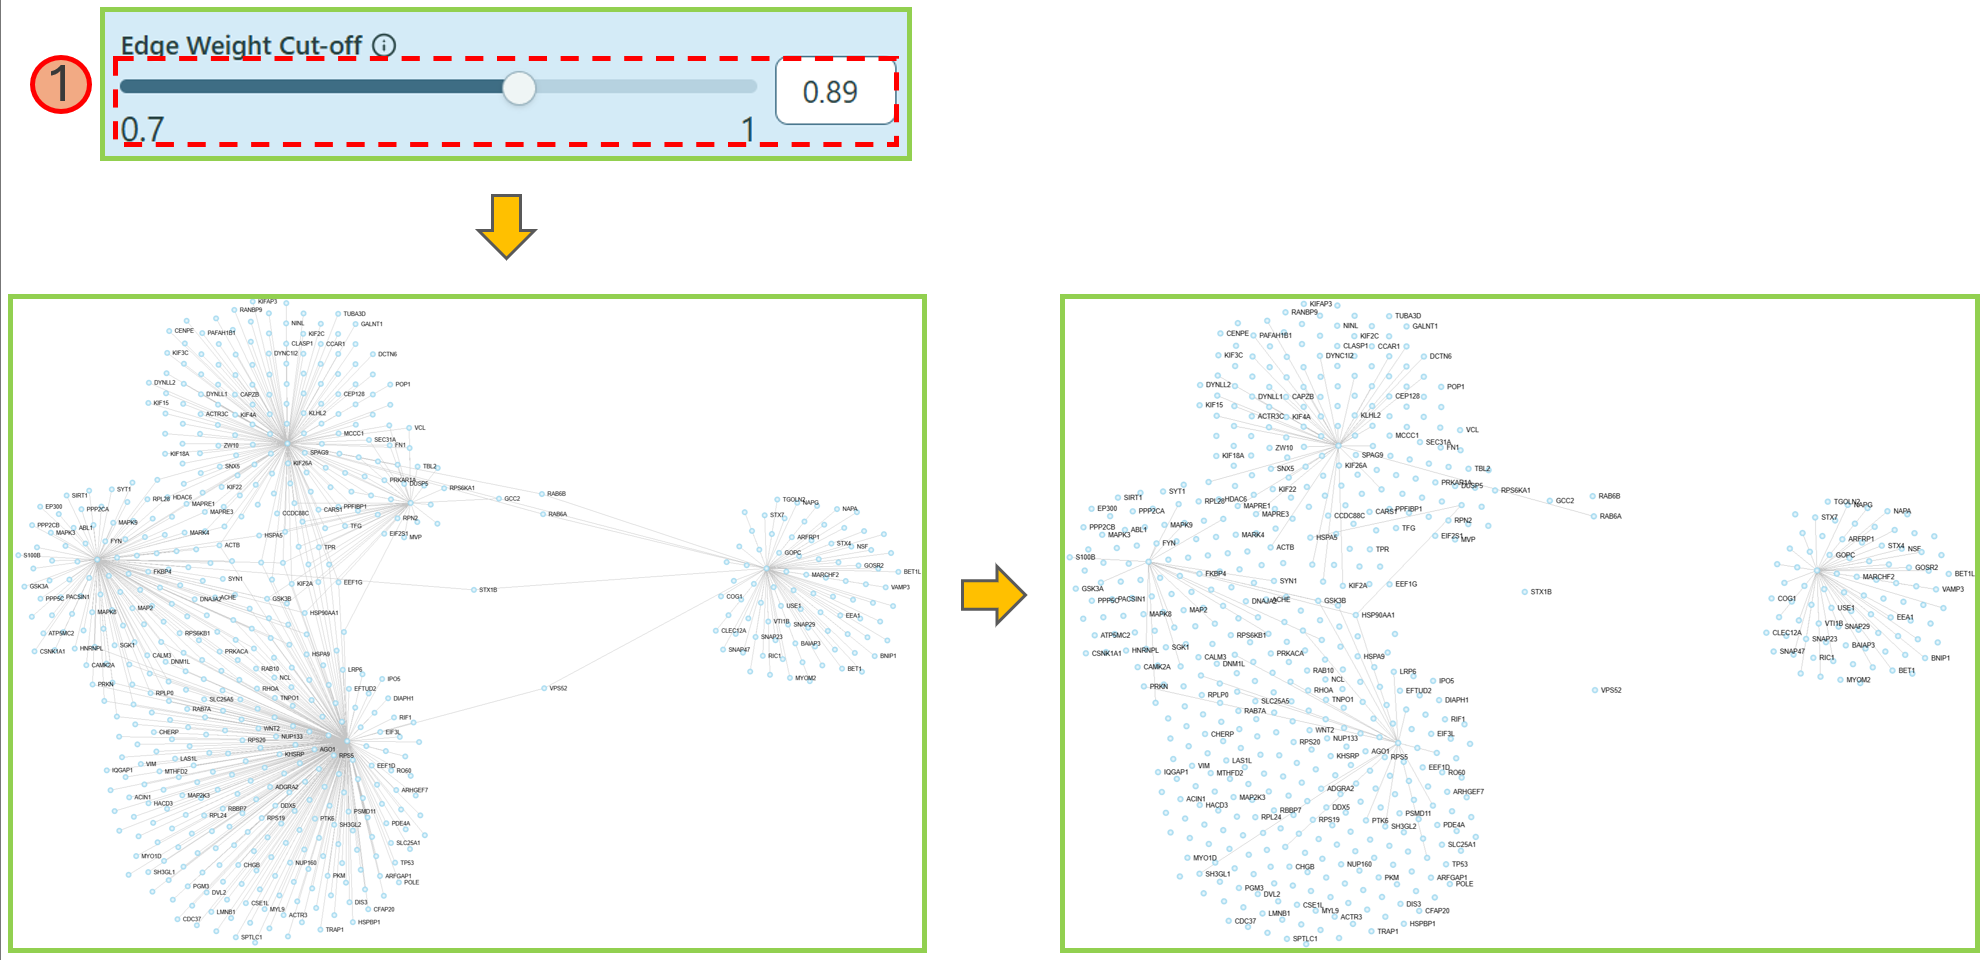 Edge weight cut-off
- Node Degree Cut-off
This feature allows you to shrink the network based on the node degree of specific features.
- In the dropdown list, you can select your preferred feature.
- Use the range slider or directly type in the proper number to select an appropriate gene degree, making the network reduced as you want. We currently provide 2 types of values to reduce the network — Gene degree and Tissue Specificity values.
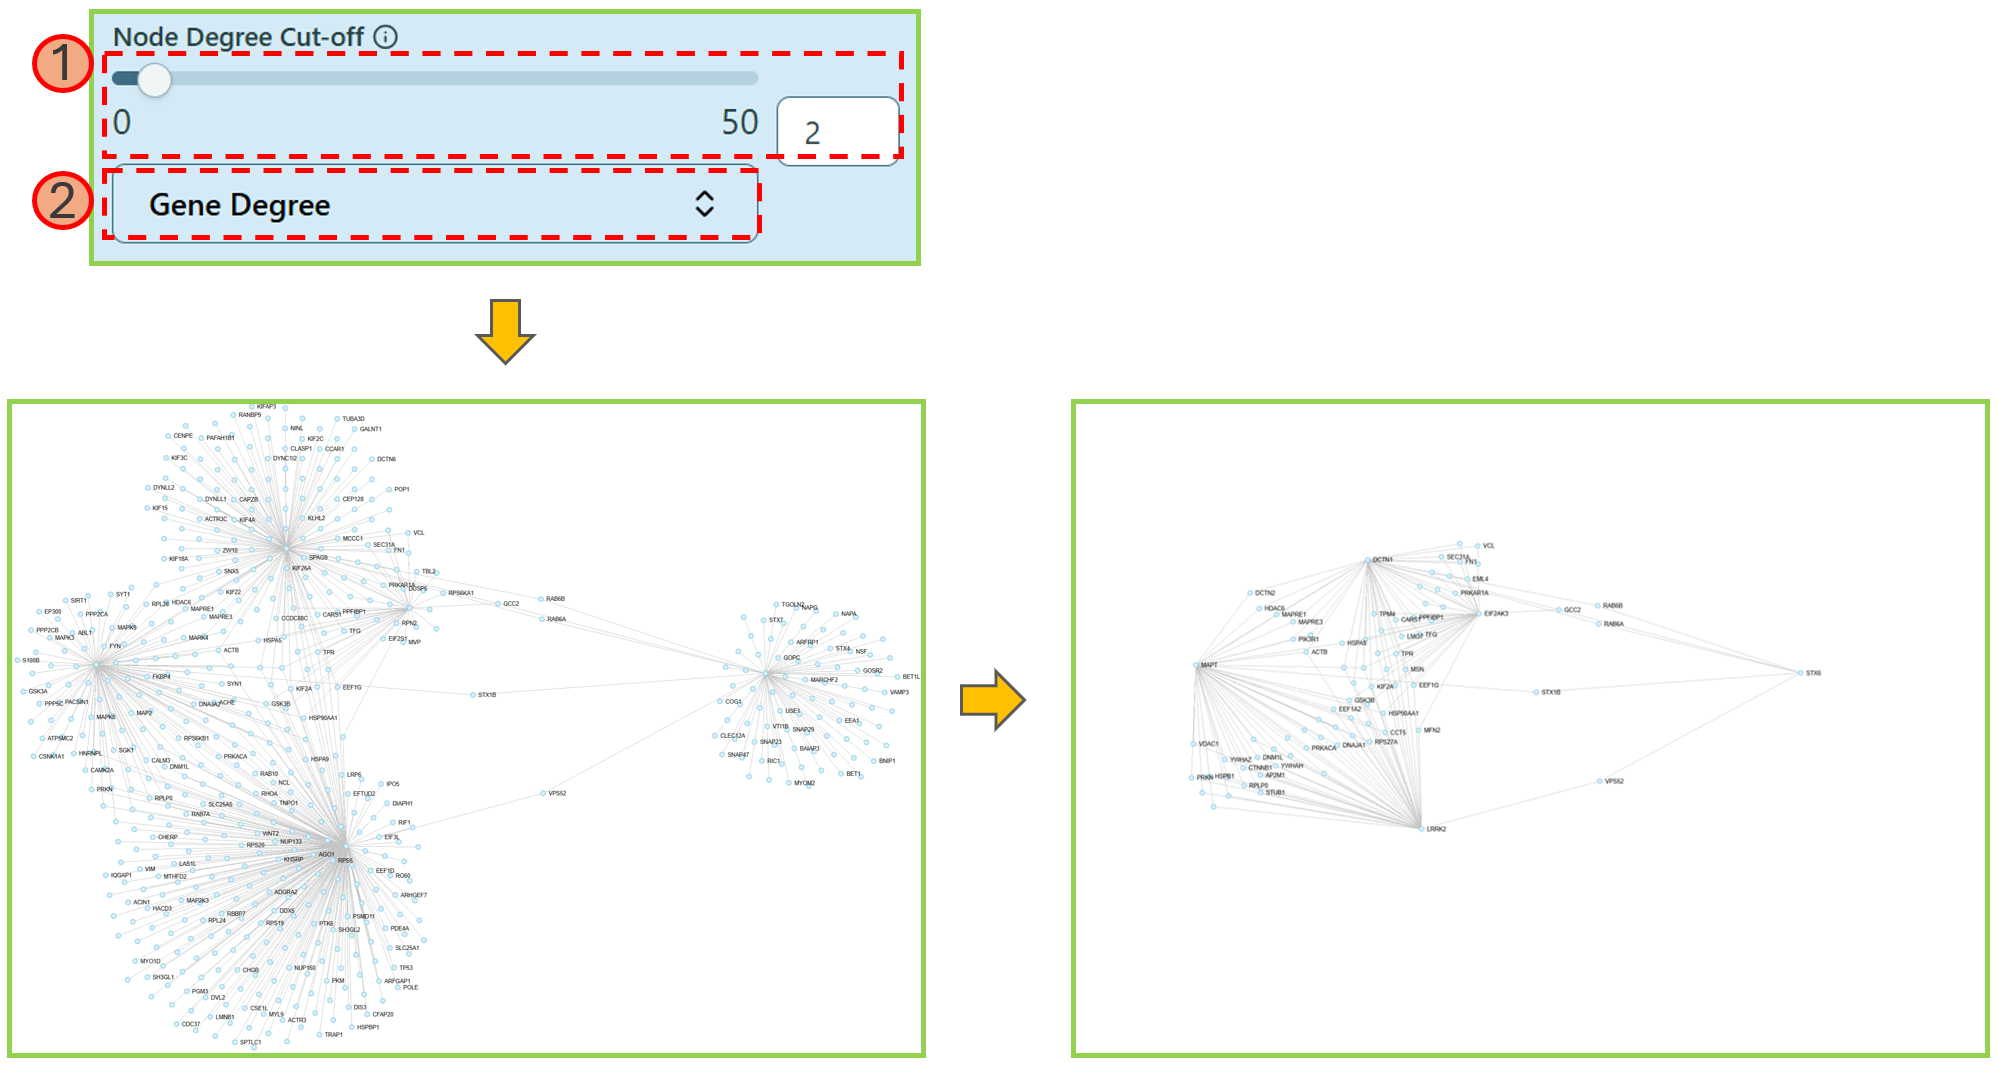 Node degree cut-off
- Hub Genes
Hub Genes will highlight the nodes only with larger or equal to the number of edges defined by yourself.
- Use the range slider or directly type in the proper number to select an appropriate value to highlight the nodes with node degrees more than or equal to the selected value.
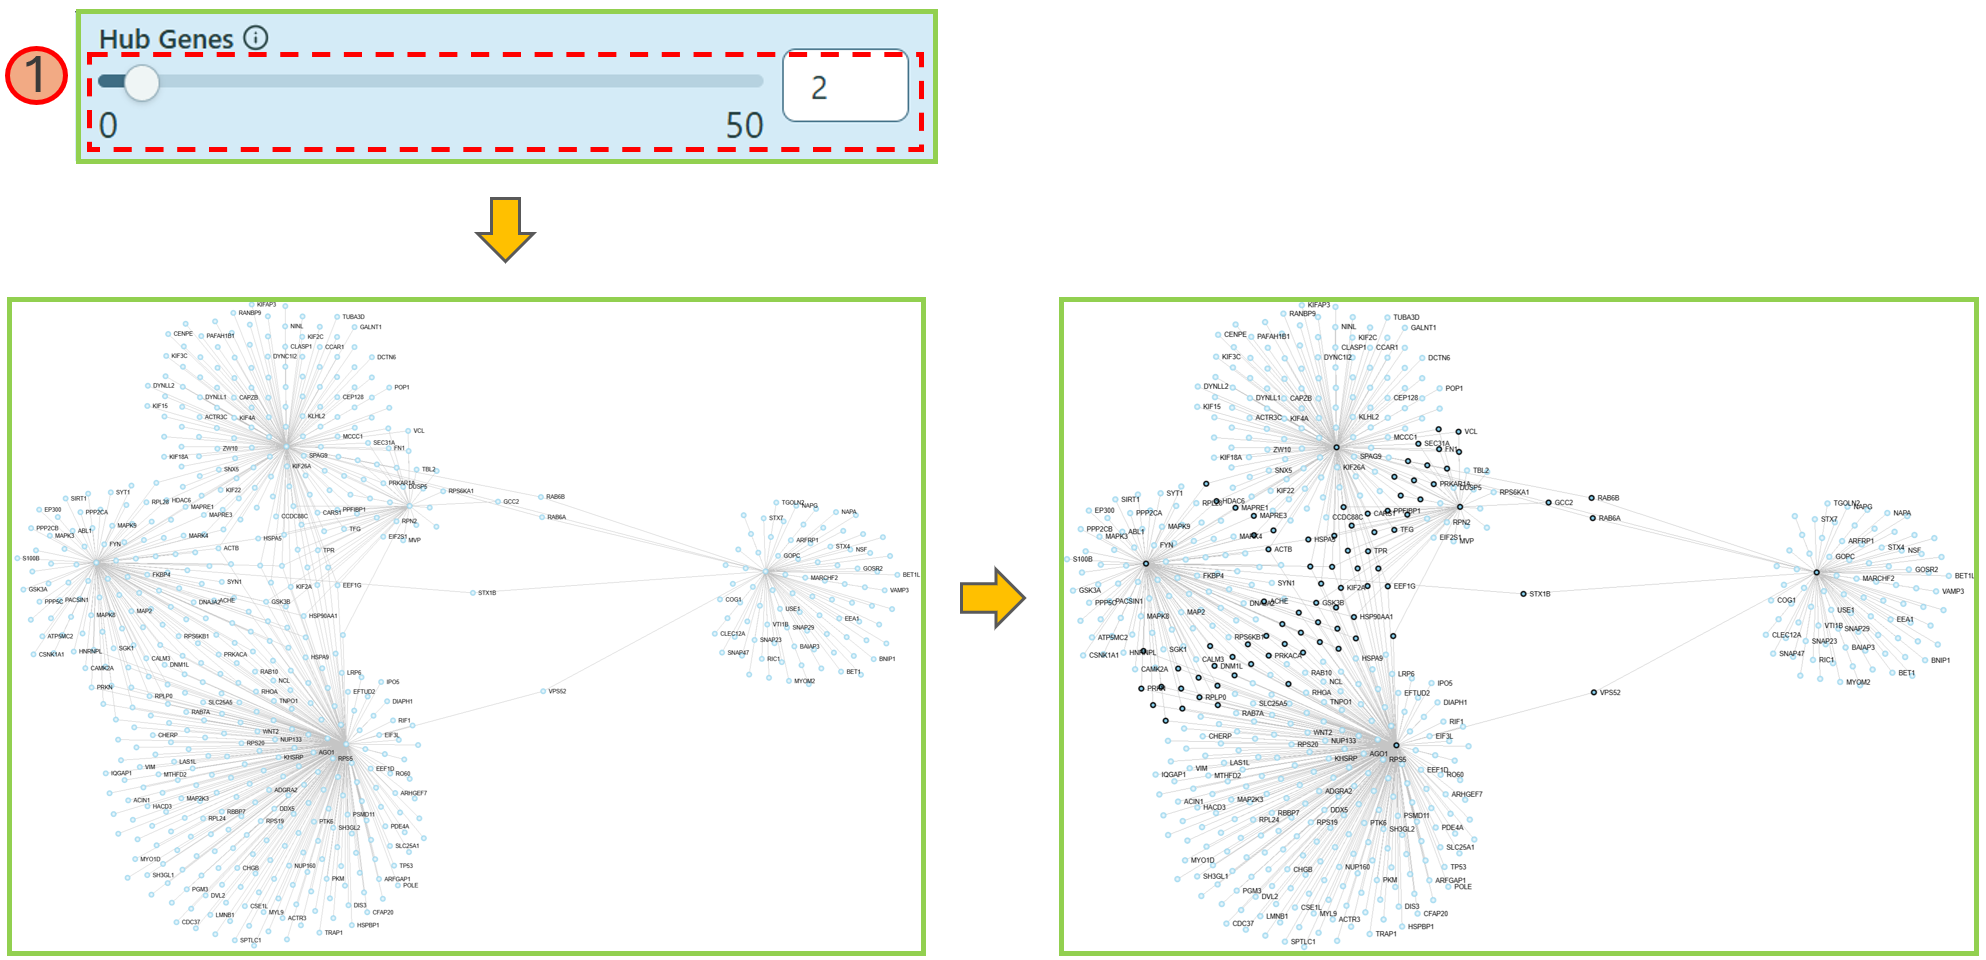 Hub genes
Custom Search
You can find nodes in the network.
- Locate the Search Genes search box.
- Enter the gene names or Ensemble IDs into the search box.
- The nodes you are looking for will be highlighted in the network.
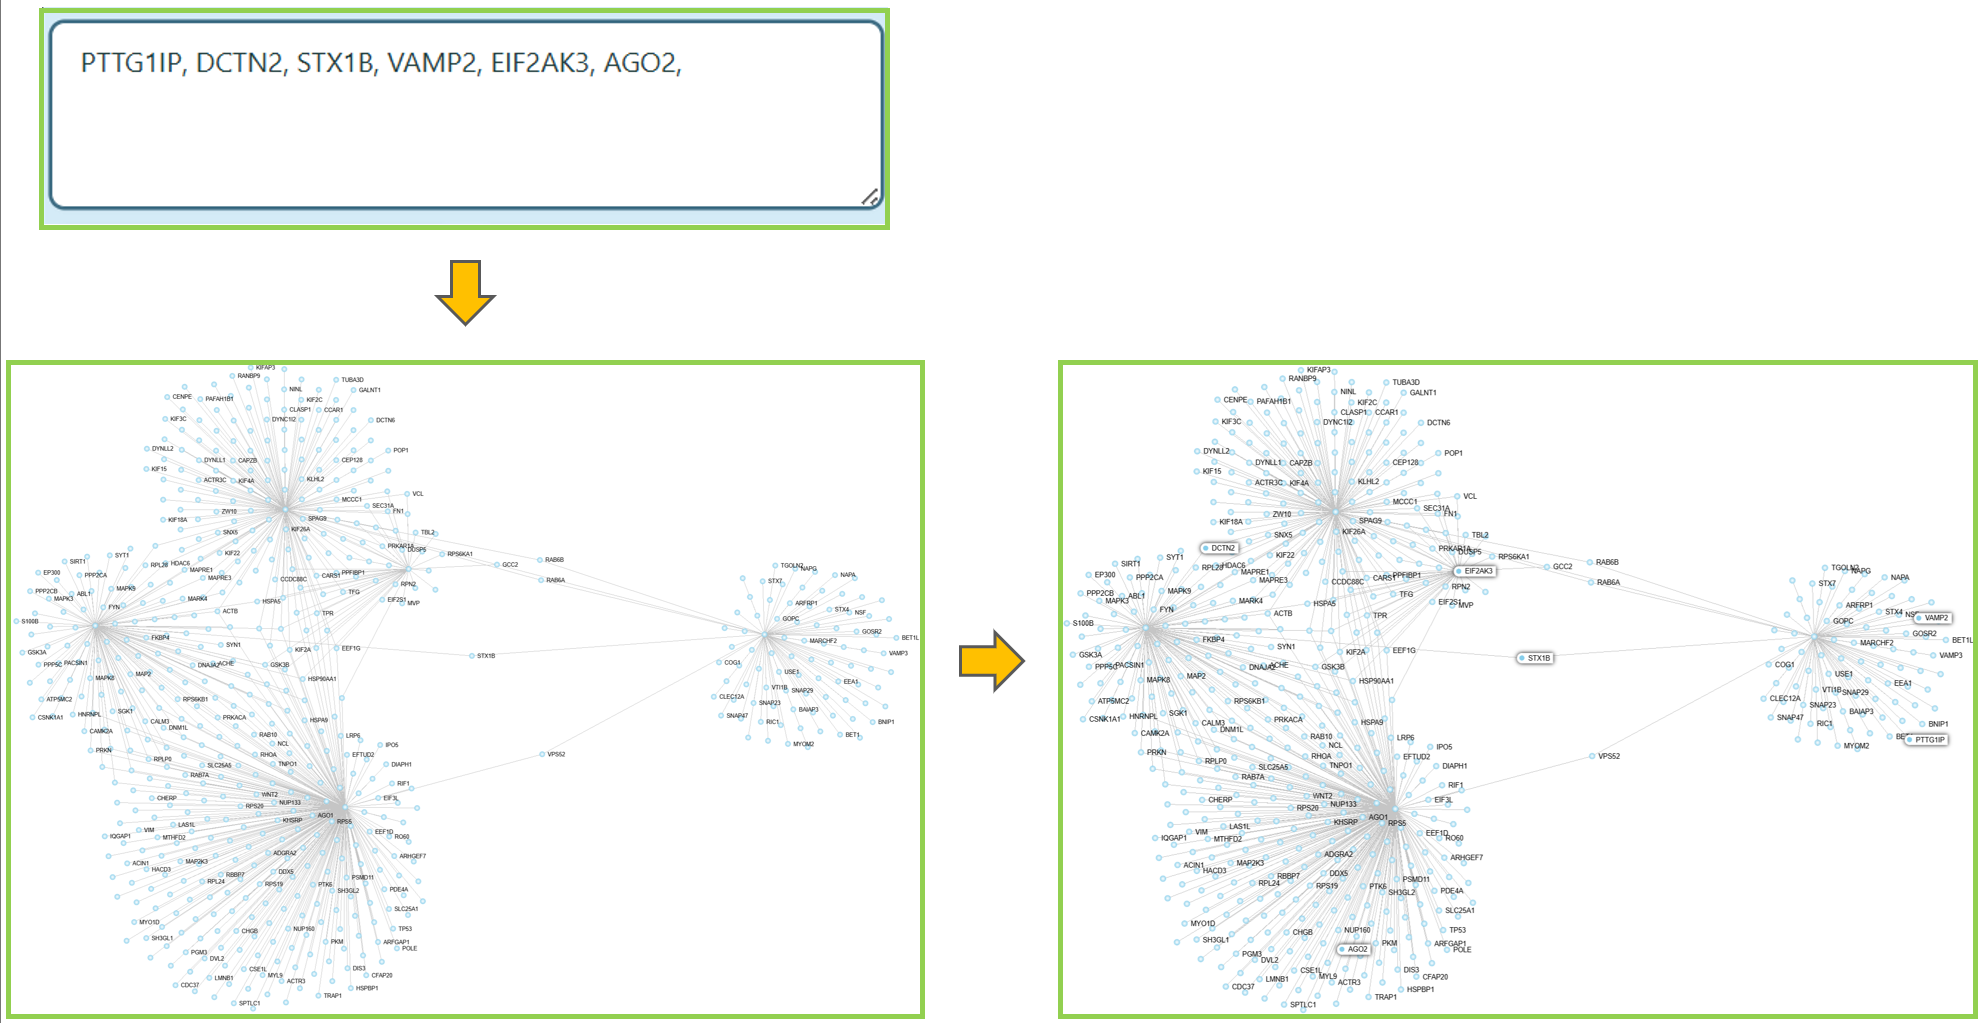 Custom search
Custom Upload
You can upload your own customized data to analyze the network, instead of using the existing data. Here is a help video.
- Upload a CSV file with your own data, please refer to the File Format below.
Note: We allow multiple files to be uploaded.
- Click Submit.
- Locate Node Color and/or Node Size section and select the corresponding uploaded feature name.
Note: The uploaded data column name will be shown in the dropdown list of Node Color and Node Size section, with the prefix [User].
- Select the column name of your customized data.
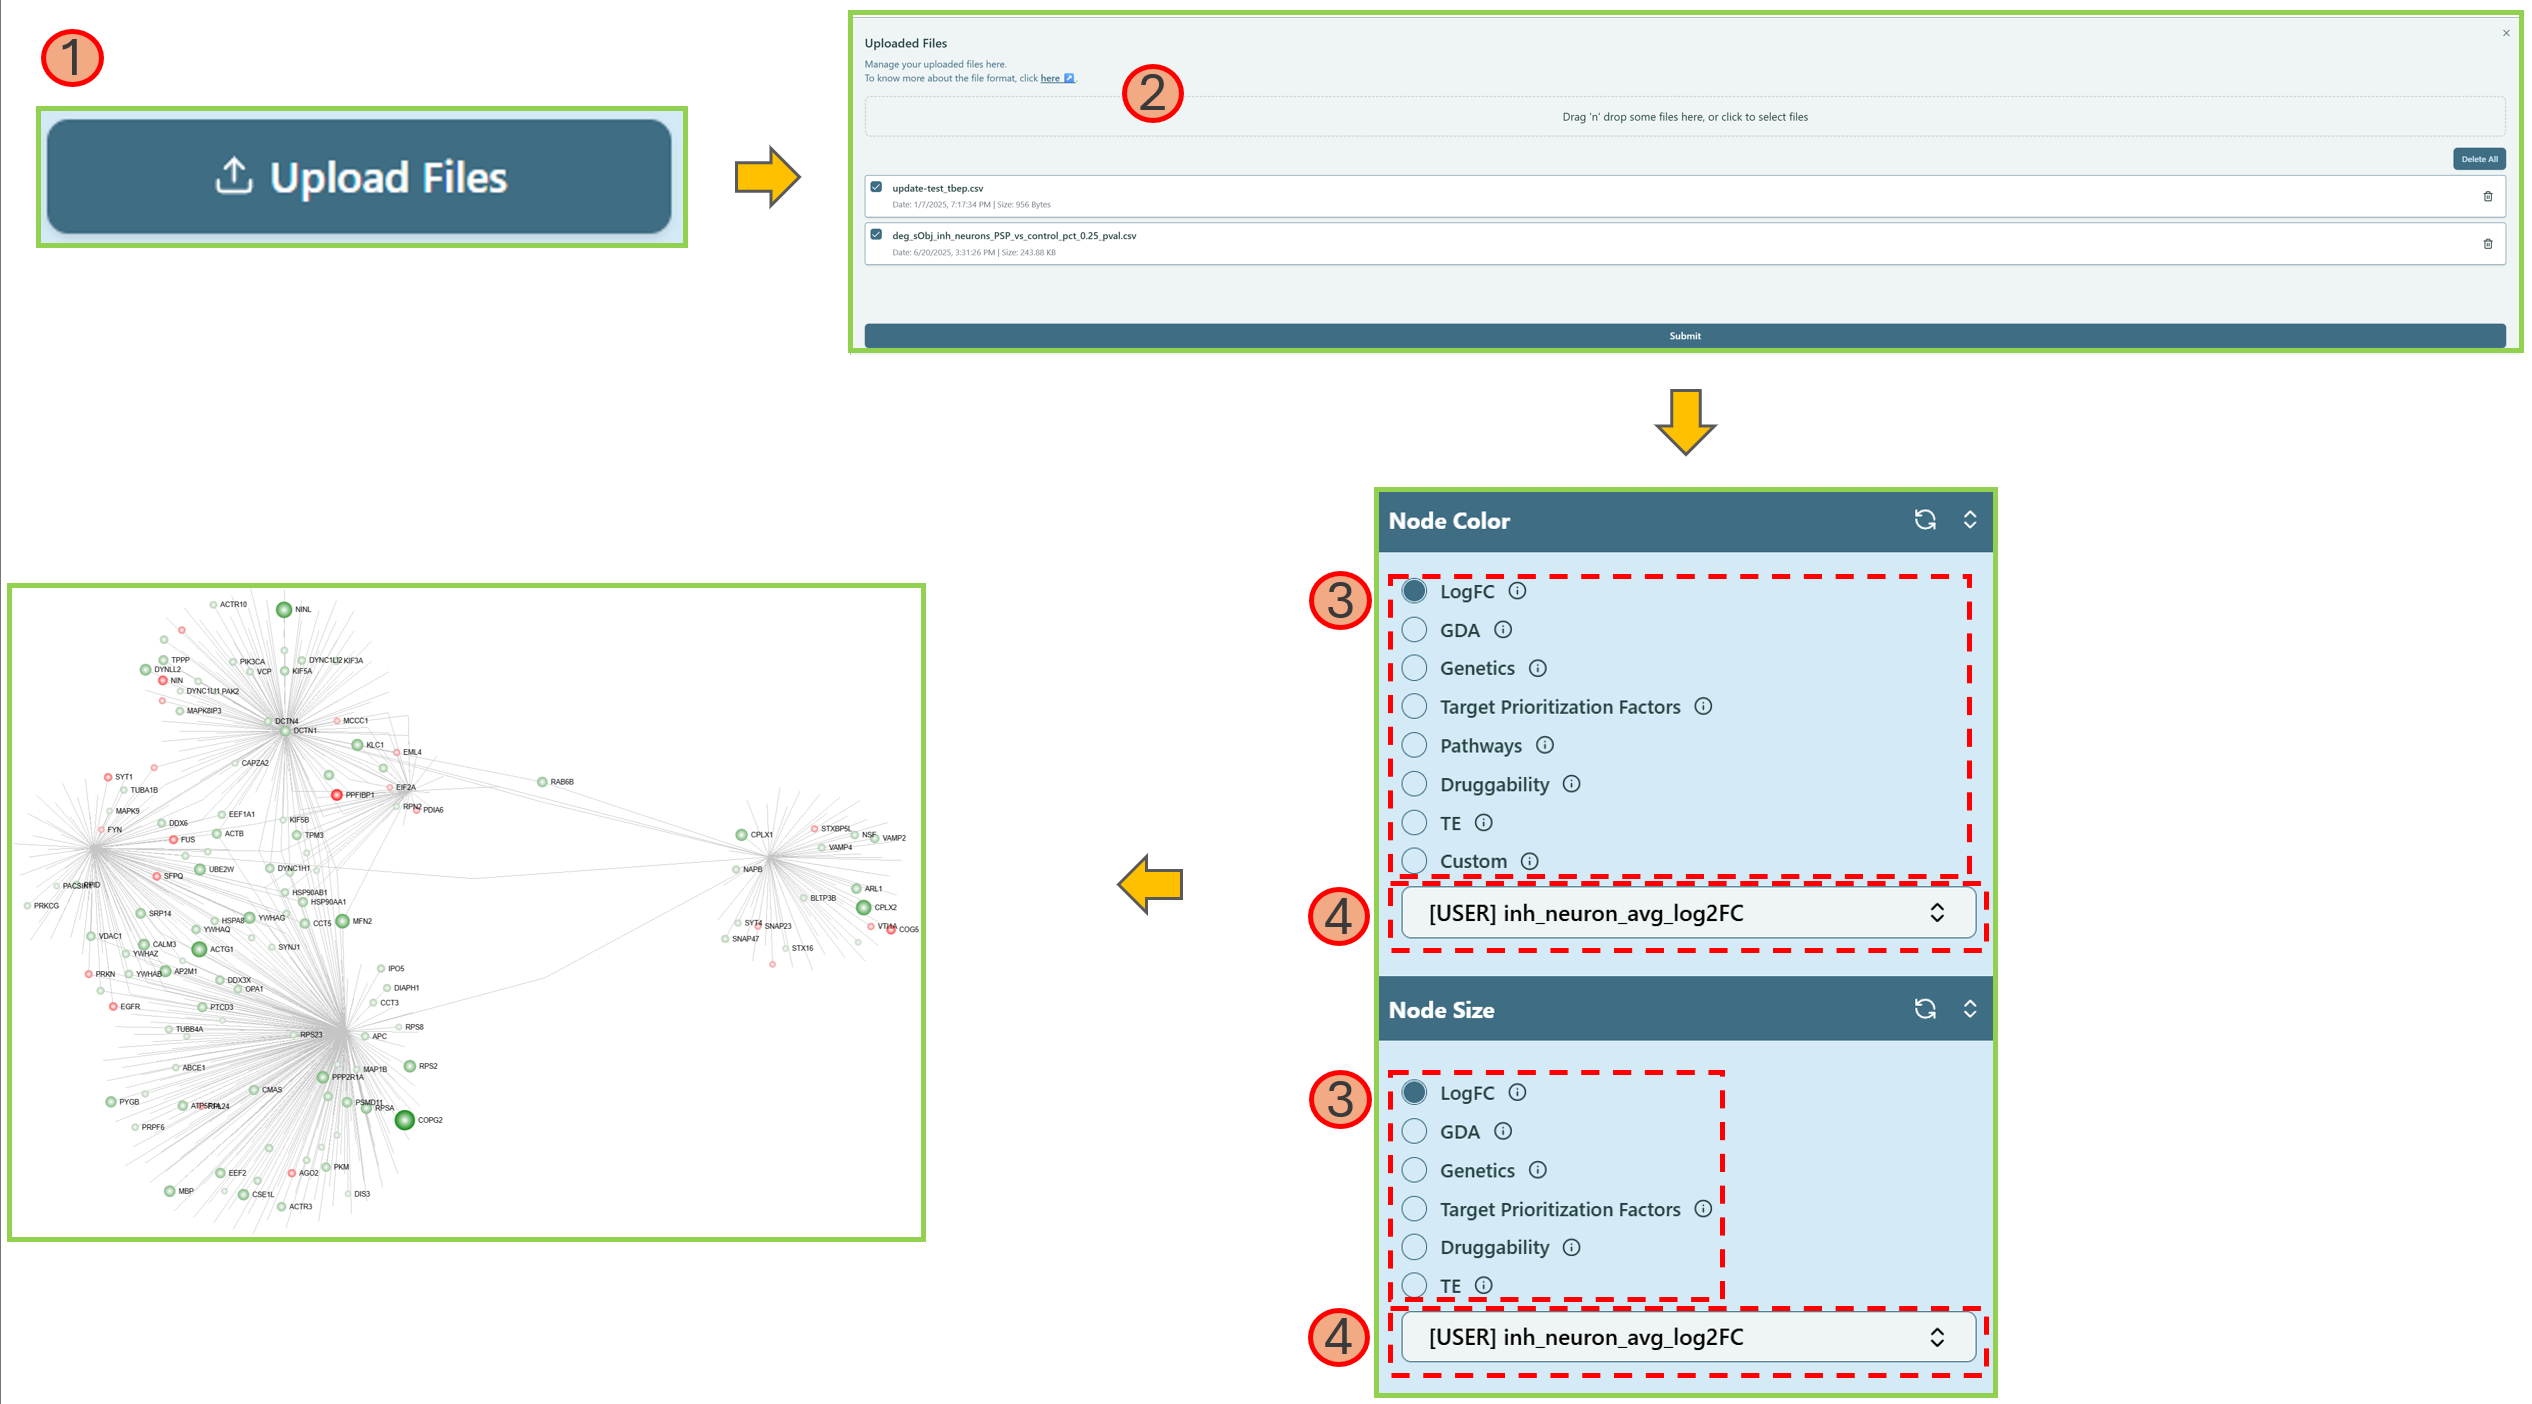 Custom upload
If you don’t need the customized data anymore, you can click the Reset button ![]() to remove the data.
to remove the data.
File Format
- The table below elaborates the naming convention, and the value ranges for all the supported features (data types).
- “Custom” data type is for customized color purpose. For example, if you find all the features do not fit your needs, you can create your own “customized feature” and color them by yourself.
| Data Type | Column Naming Convention | Value range |
|---|---|---|
| LogFC | LogFC_CustomName | [-Inf, +Inf] |
| GDA | [GDA|OpenTargets]_CustomName | [0, 1] |
| Genetics | [GWAS|Genetics]_CustomName | [-1, 1] |
| Target Prioritization Factors | OT_Prioritization_CustomName | [0, 1] |
| Pathway | Pathway_CustomName | Binary (0/1) |
| Druggability | Druggability_CustomName | [0, 1] |
| Tissue Enrichment | TE_CustomName | [0, +Inf] |
| Custom | Custom_Color_CustomName | Any hex color code or CSS color name, see list here ↗ |
- The CSV file below provides an example of what the real file looks like.
- The first column must be either gene name or Ensembl id (column name doesn’t matter)
- The prefix of columns is case-insensitive
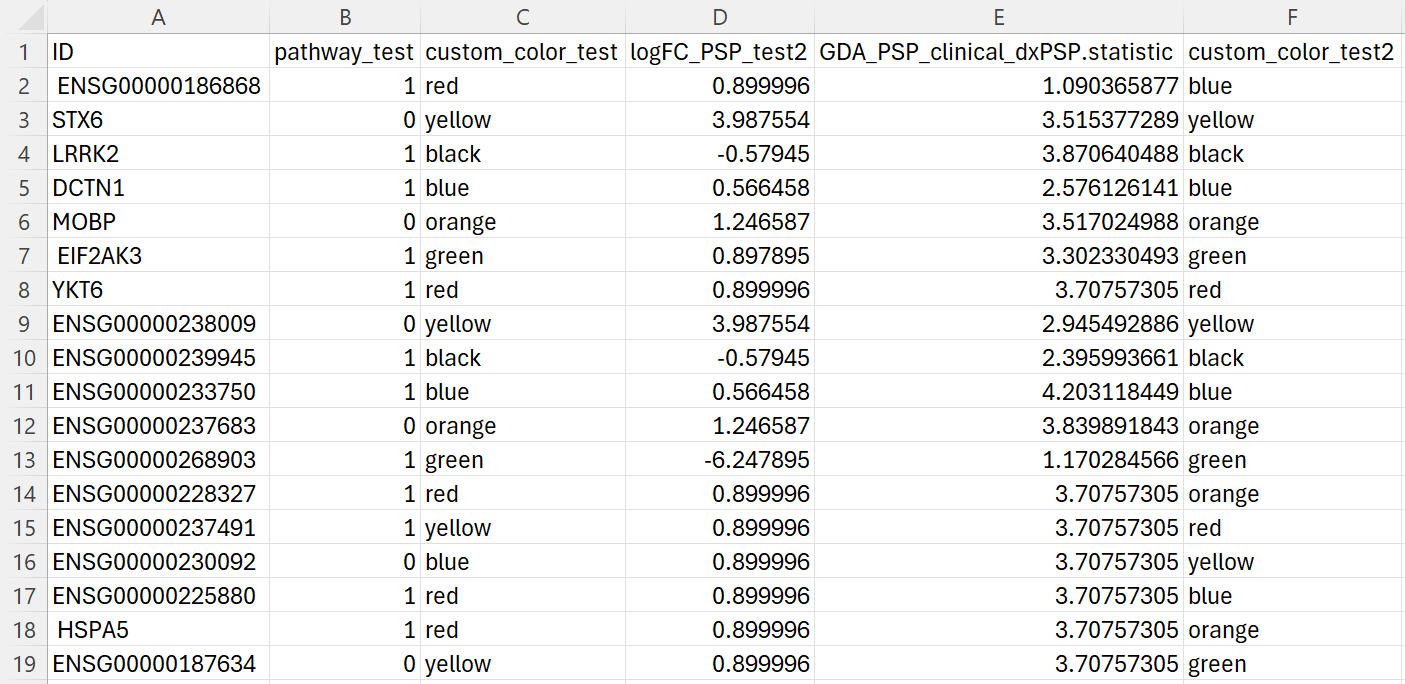 Example of a customized CSV file
Network Export
You can export the network you created. Please refer to the Network Export section in the Network Visualization Board page for more details.