Right panel
Modifications of inherent network parameters
Now we focus on the functions of right panel.
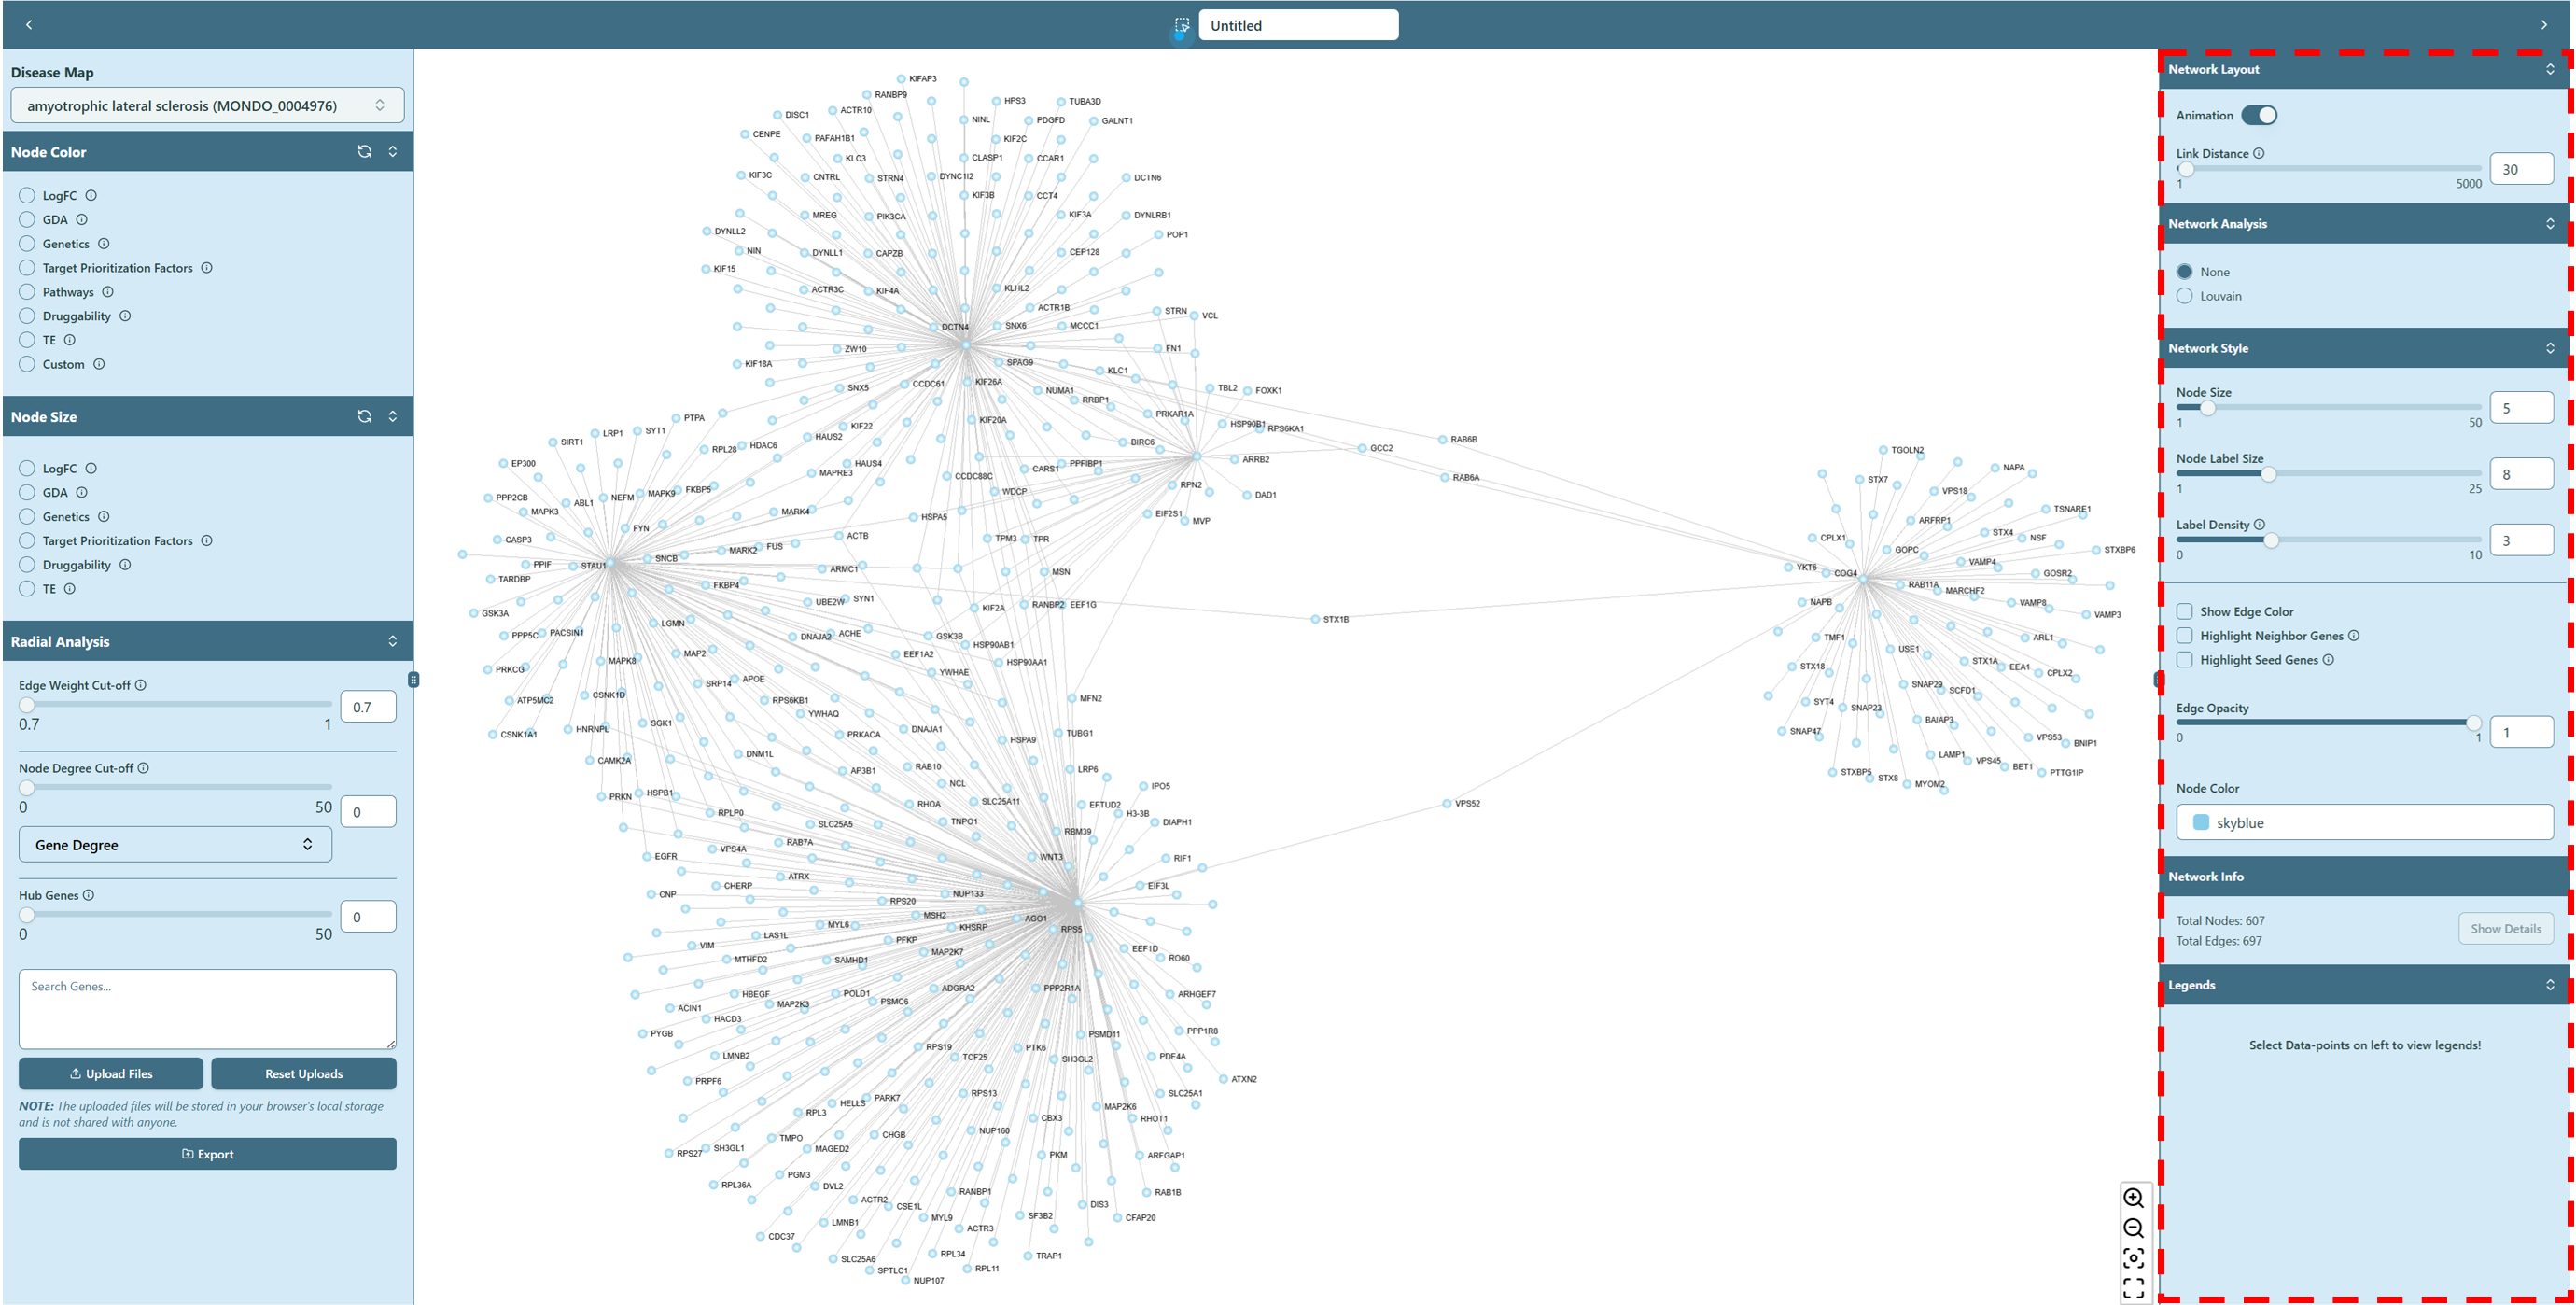 Right panel of network visualization page
Network Layout
You can switch “Stop Animation” toggle  to stop dancing of the network.
You can also make the node clusters more separated. Use the range slider or directly type in the proper number in Link Distance, this will make the edge of the network longer, helping the clusters separated from each other.
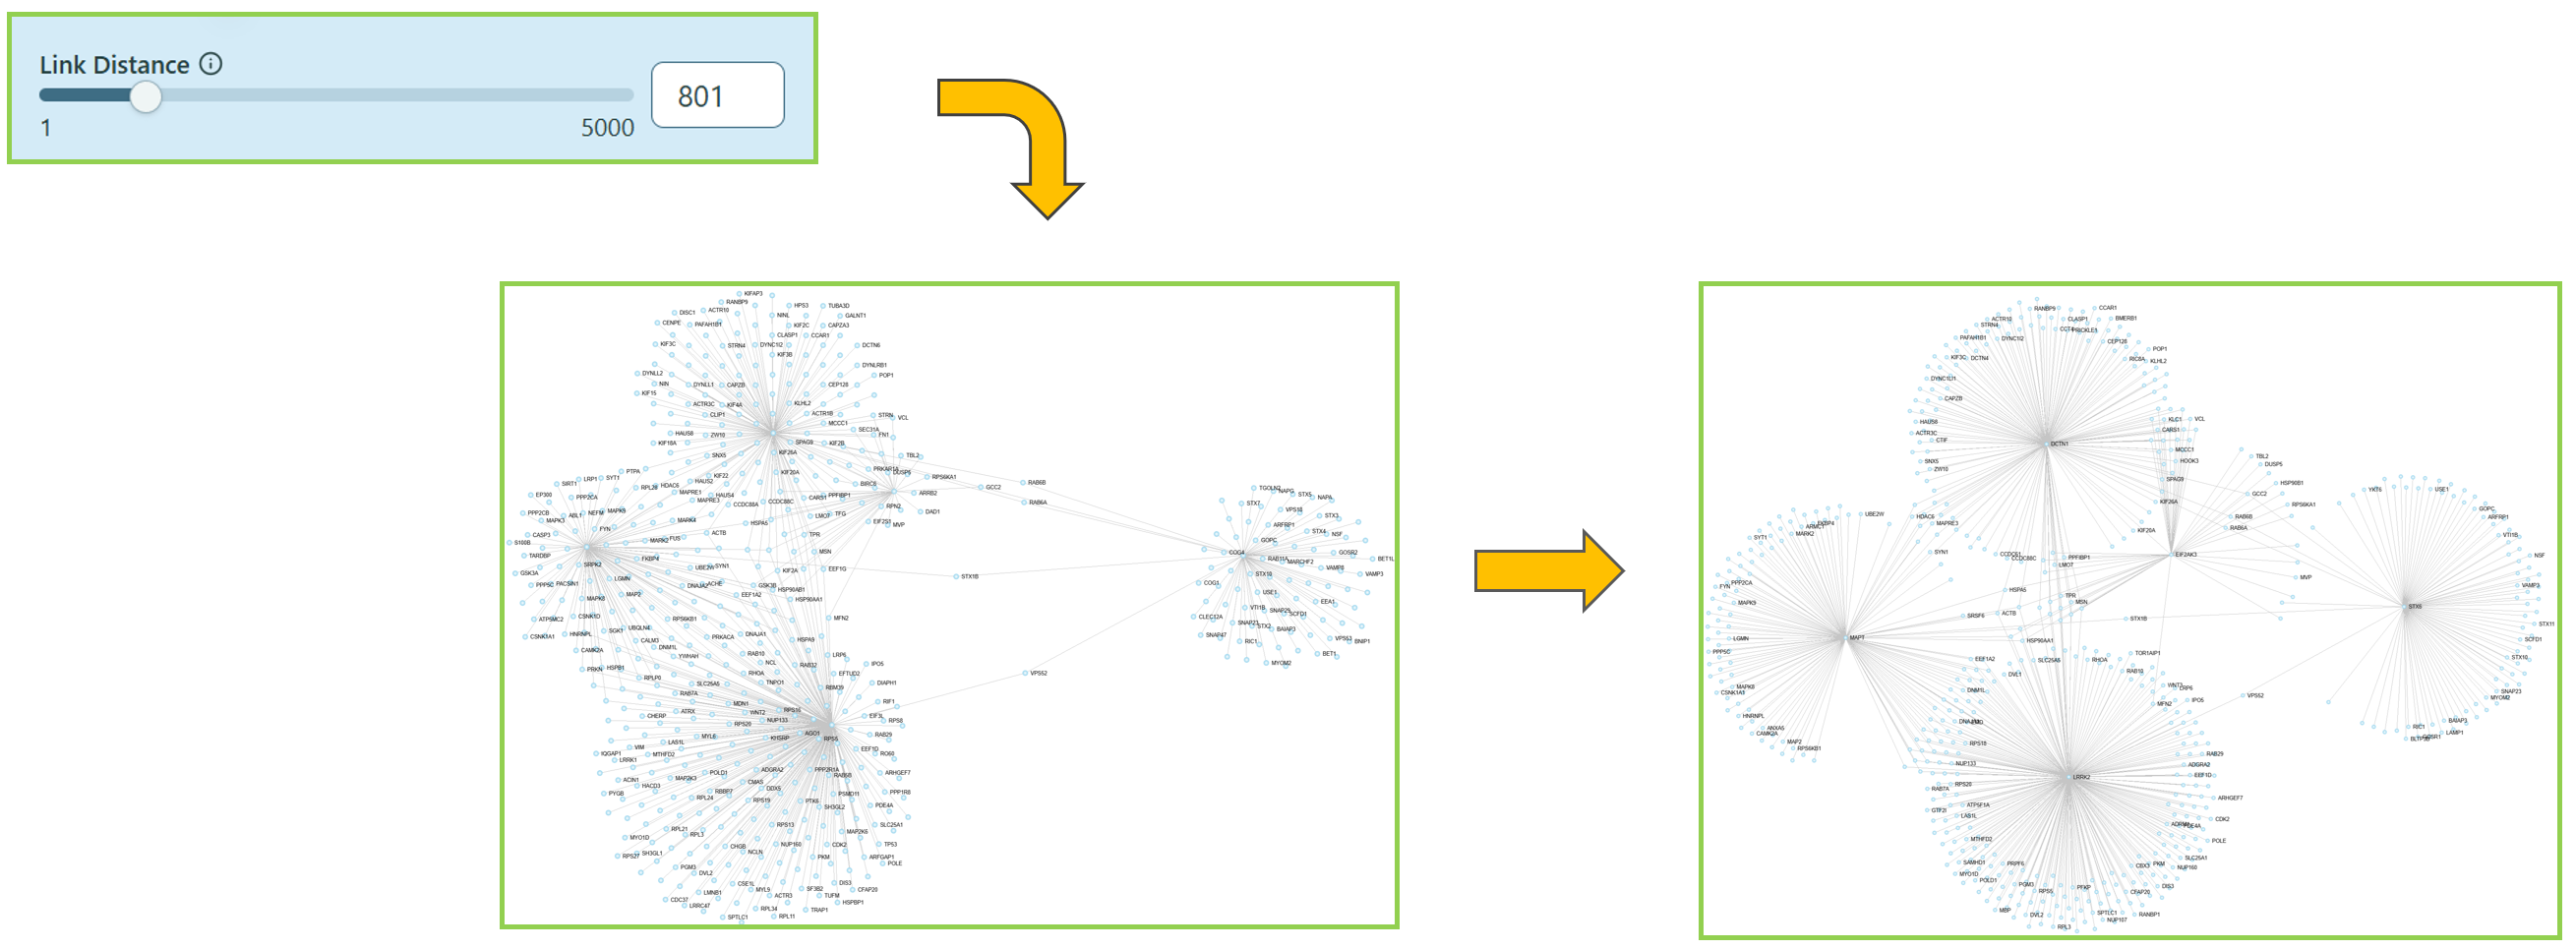 Change Link Distance
Network Analysis
You can reduce the network complexity and focus on the key drivers of your network here by selecting different radio buttons.
- Louvain
We offer community detection algorithm Louvain [1] in our tool, you can easily use this algorithm to find possible communities in the network, based on your own choice of Resolution, Minimum Community Size and Weighted. Here is a help video.
- Click Louvain.
- Select proper Resolution and Minimum Community Size, check or uncheck Weighted, to involve edge weight or not.
- Click Apply.
- Select/Deselect communities to keep/drop the detected communities in the network.
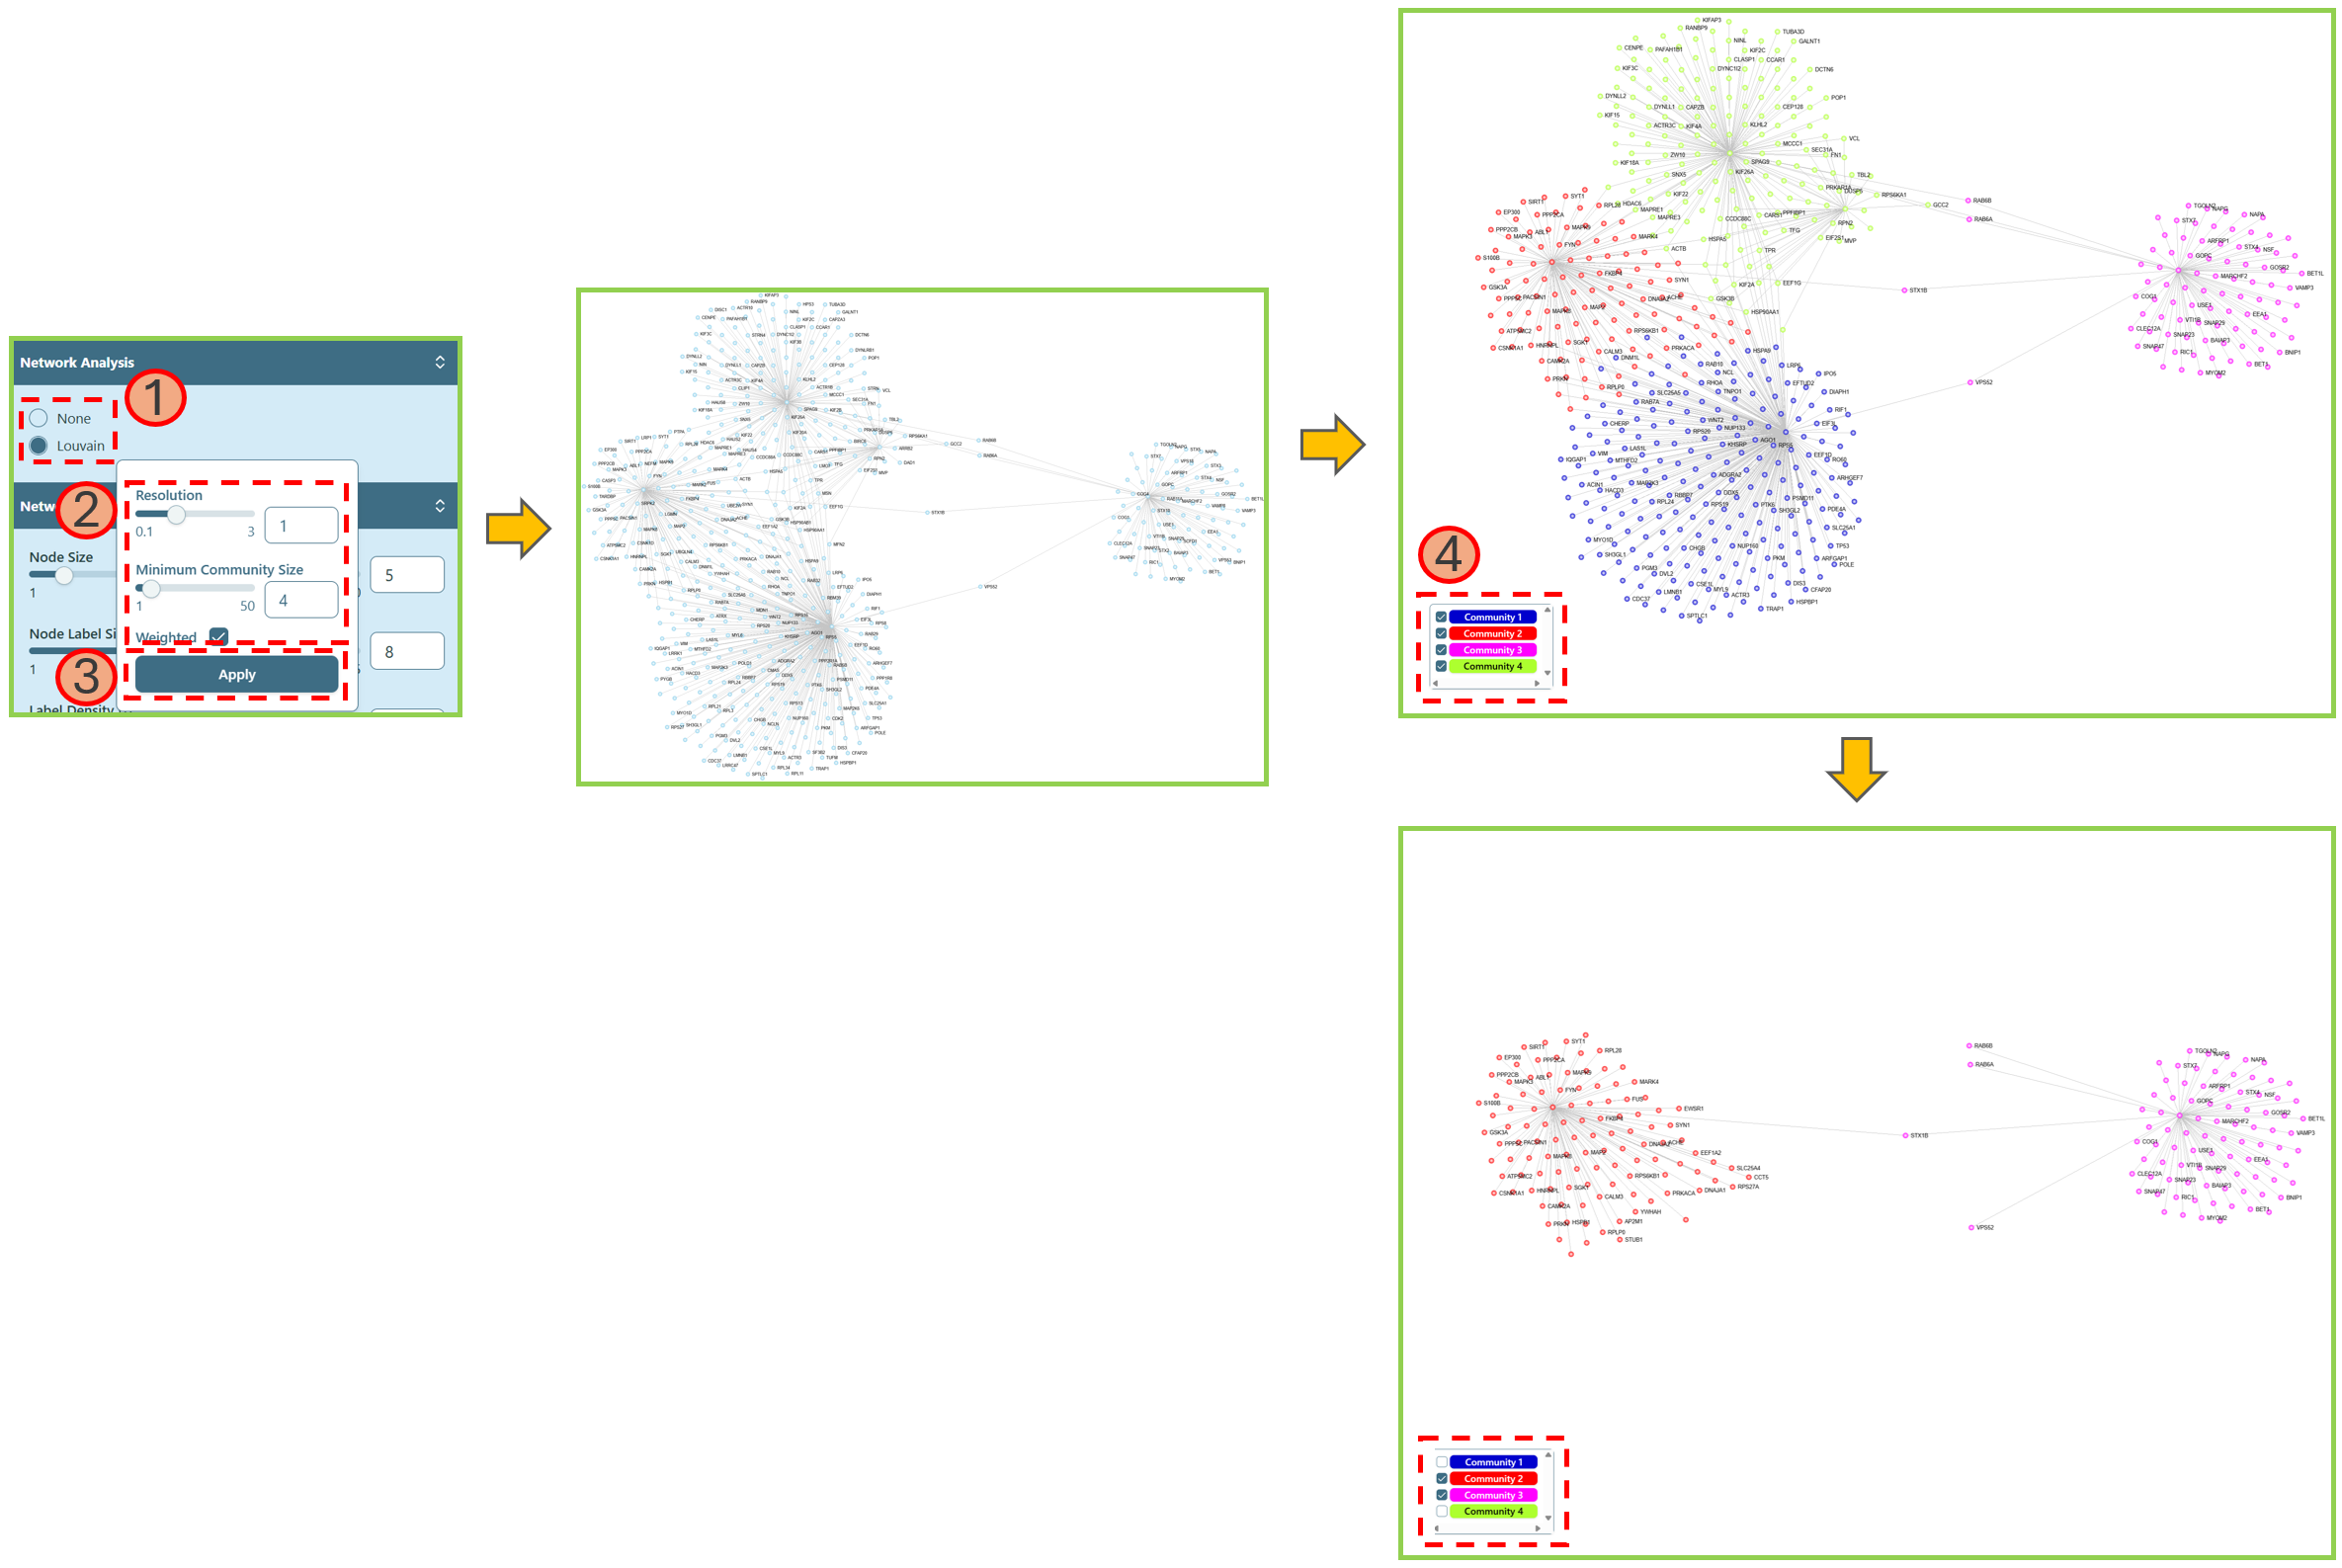 Community detection
Network Style
You can change basic parameters of the network.
- Node Size
You can make node size larger/smaller.
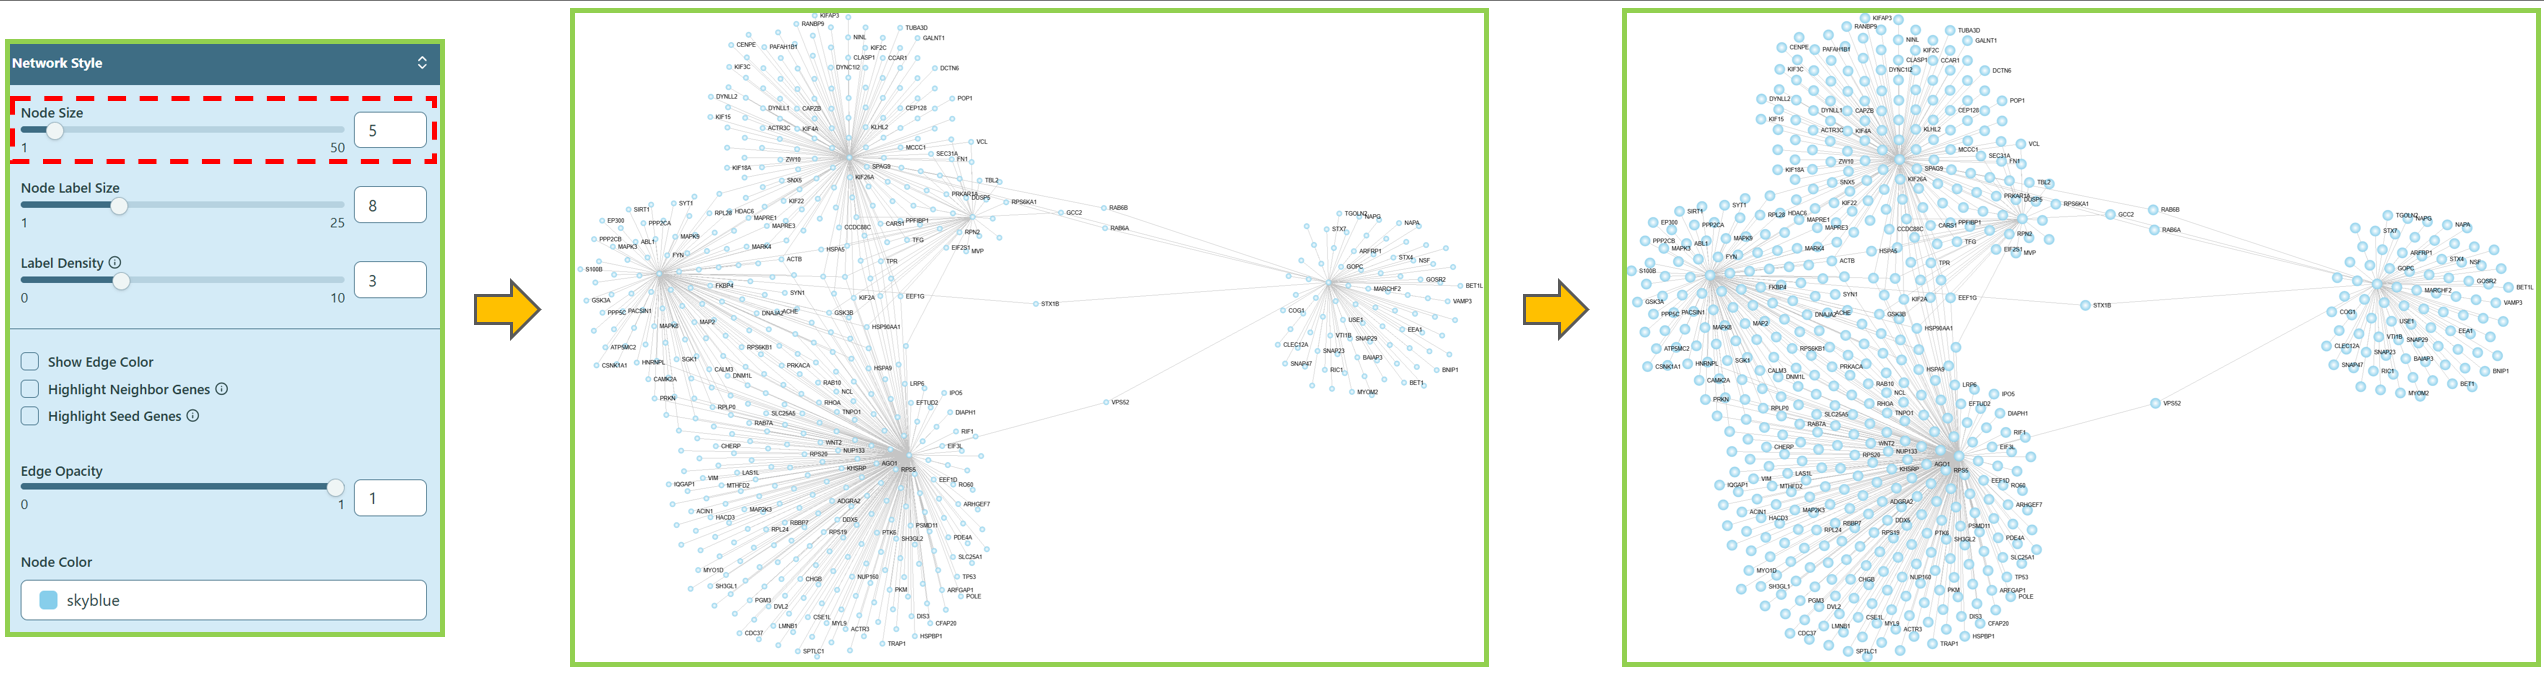 Change Node Size
- Node Label Size
You can make node label size larger/smaller.
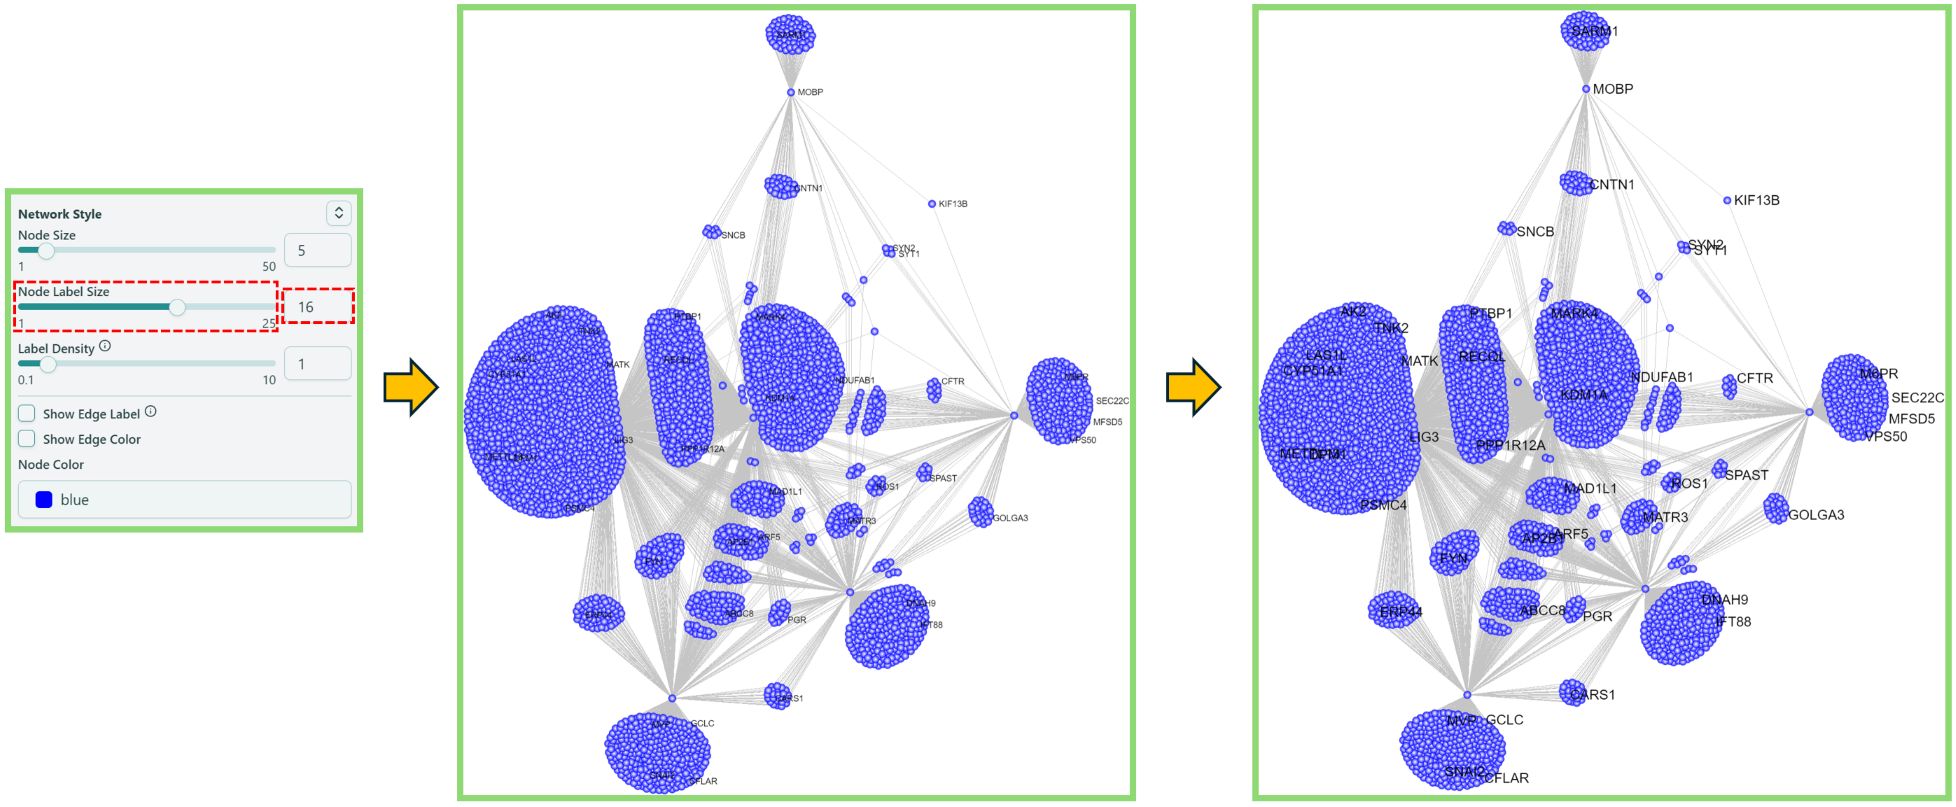 Change Node Label Size
- Label Density
You can change the label density here.
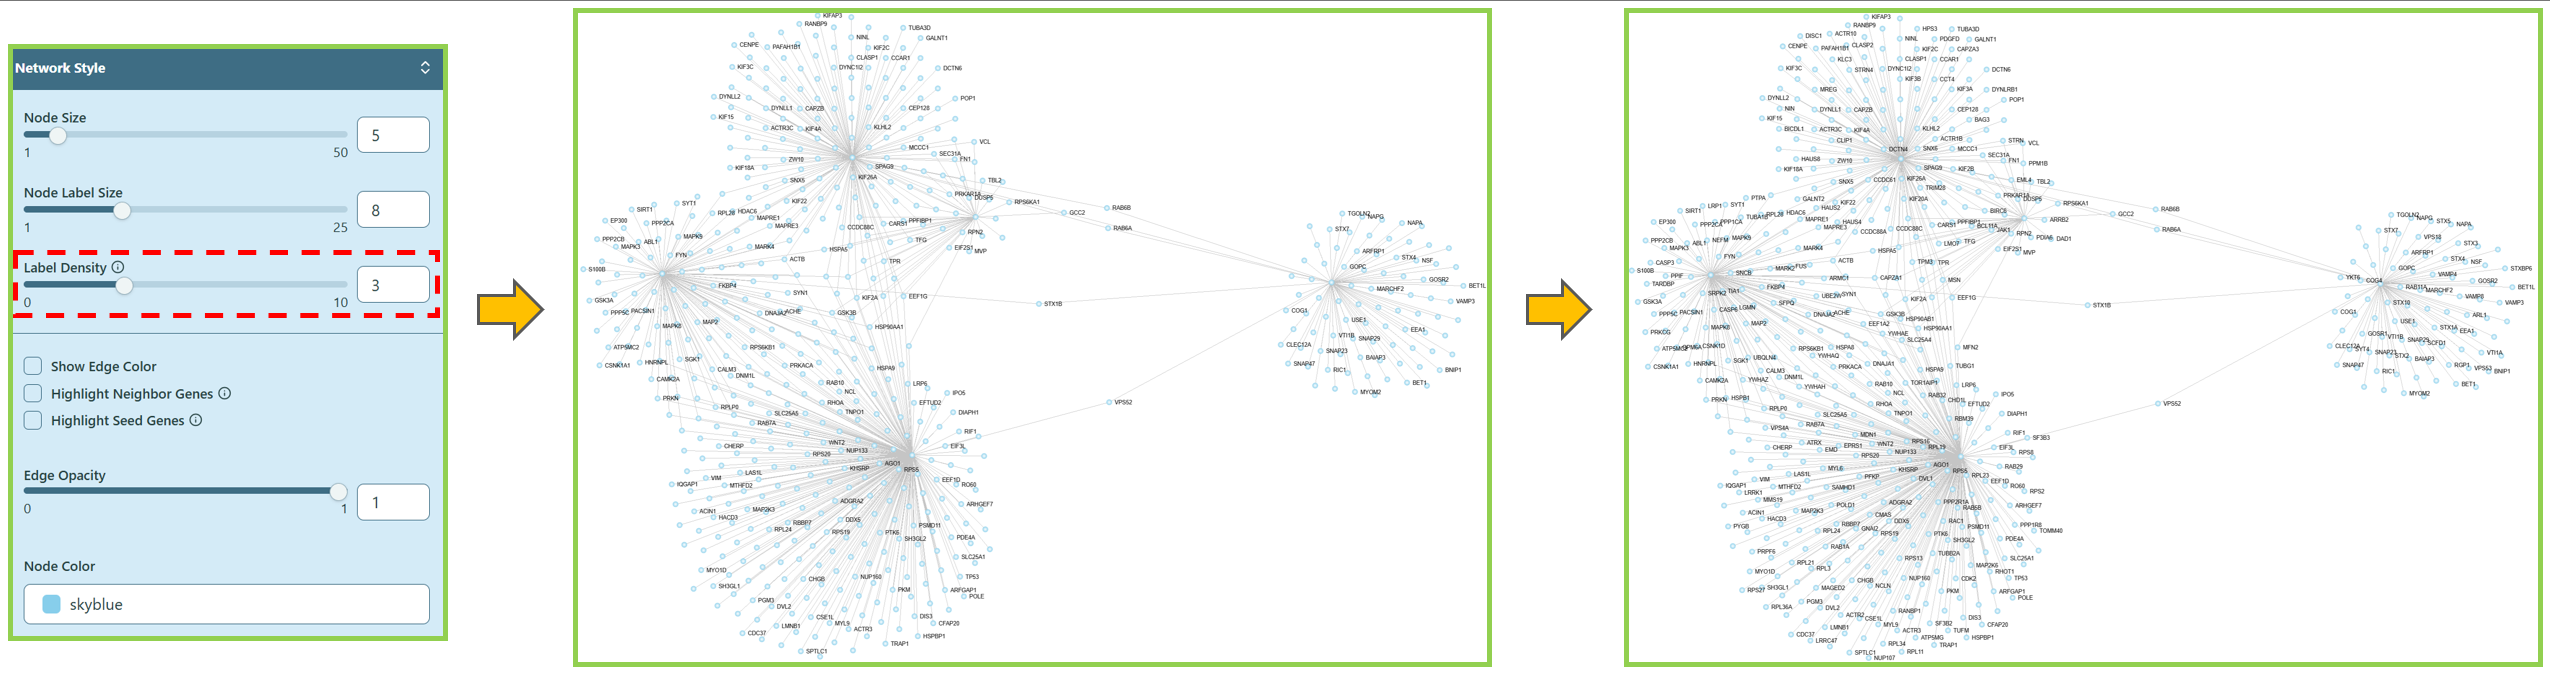 Change Label Density
- Show Edge Color
You can change the edge color here. Please refer to the Legends section on the Right Panel for the color meaning.
 Show Edge Color
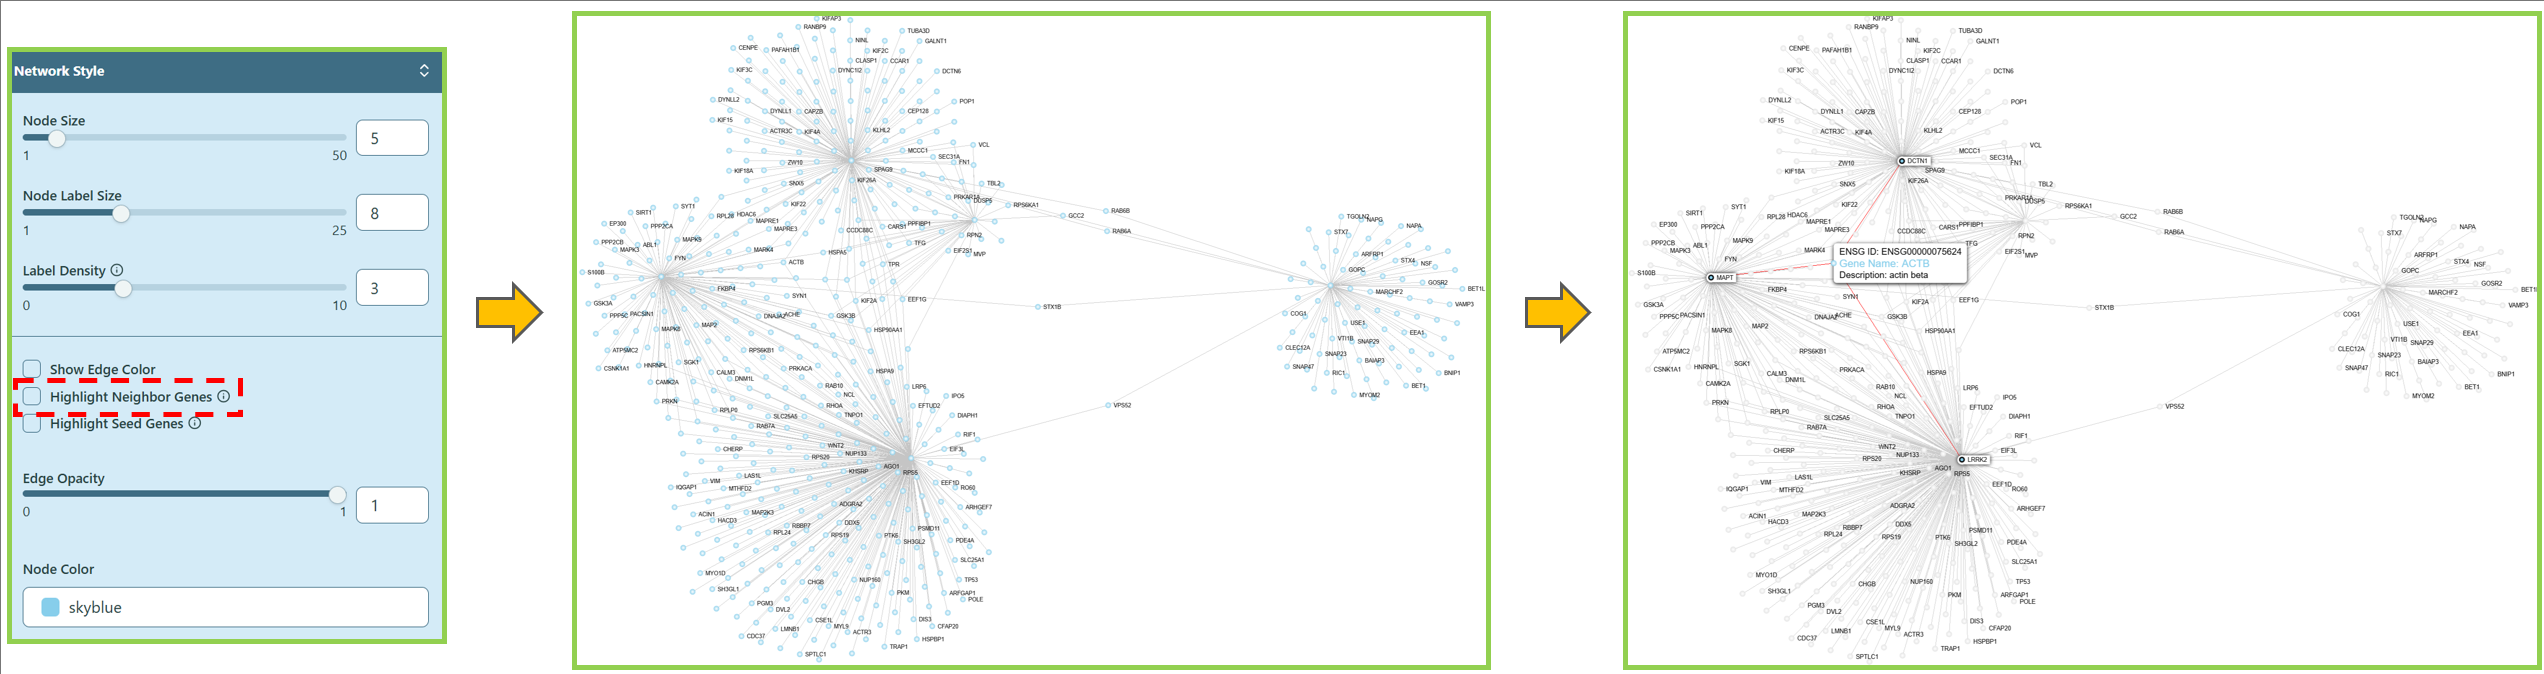
- Highlight Neighbor Genes
You can also highlight the neighbor genes of a specific gene. To do so, you can first navigate to the “Network Style” section on the right panel, and check the box of Highlight Neighbor Genes. Then either hover or click on a specific gene (node) in the network, the neighbor genes of the hovered/clicked gene will be highlighted in the network.
 Highlight Neighbor Genes
You can also refer to the information icon ![]() for more details.
for more details.
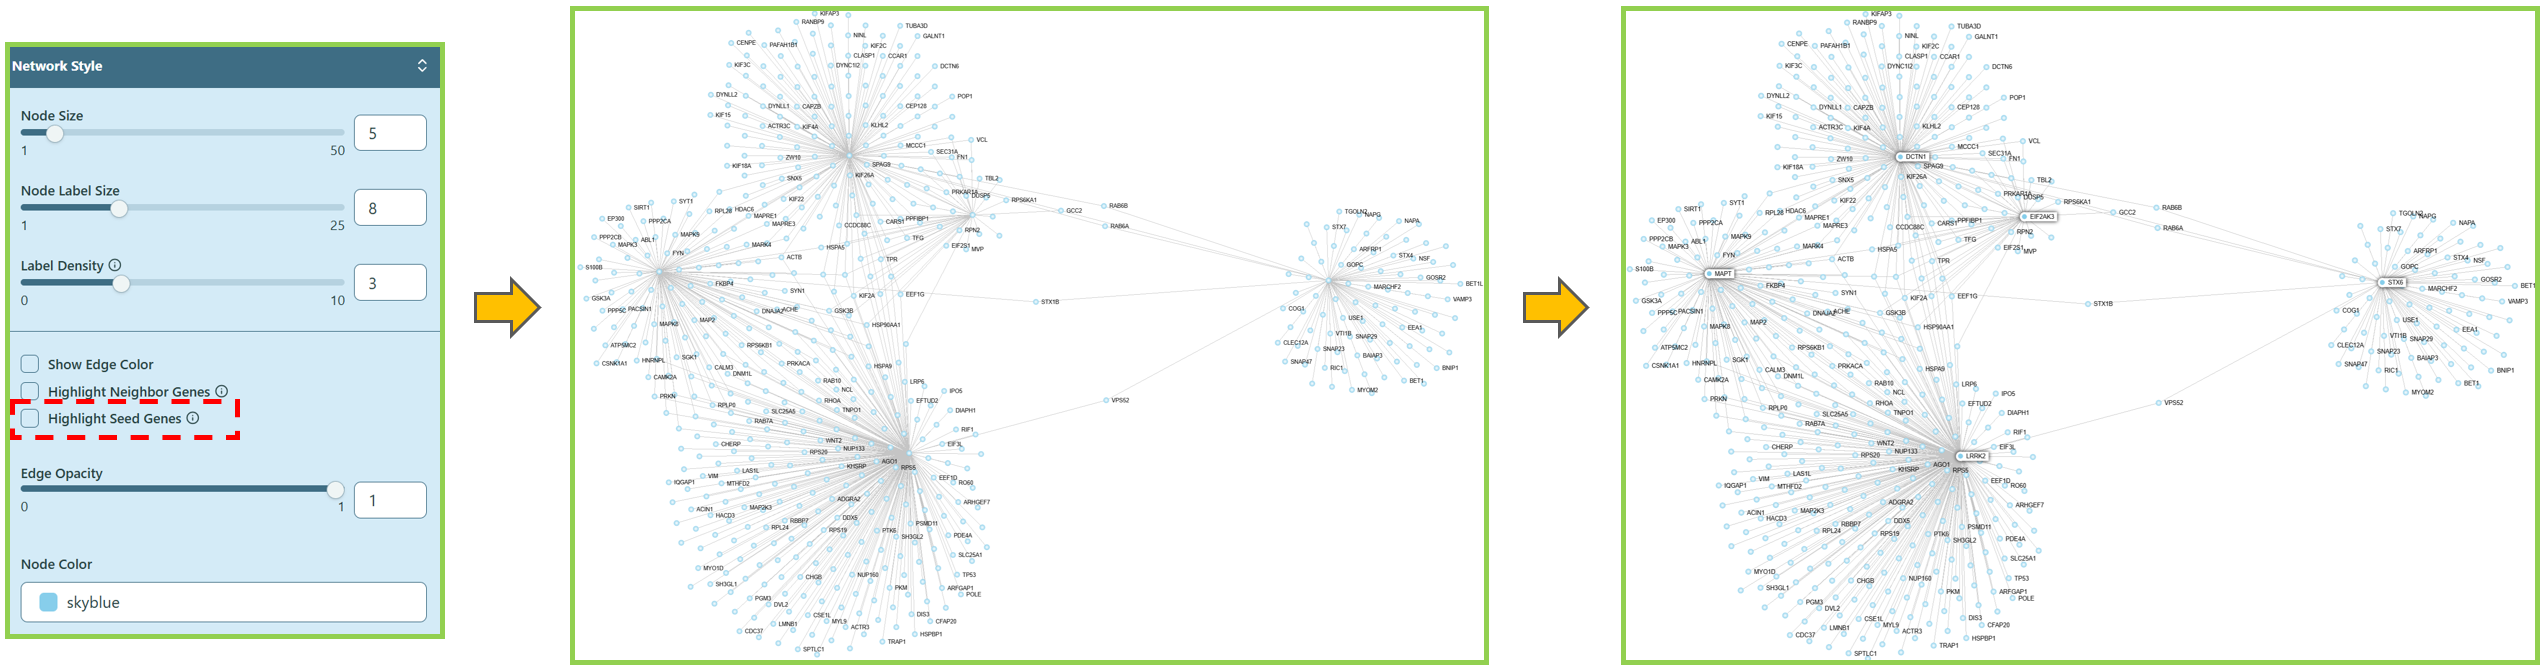
- Highlight Seed Genes
If you wish to find the seed genes in the network, navigate to the “Network Style” section on the right panel, and check the box of Highlight Seed Genes. The seed genes will be highlighted in the network.
 Highlight Seed Genes
You can also refer to the information icon ![]() for more details.
for more details.
- Edge Opacity
You can change the edge opacity here.
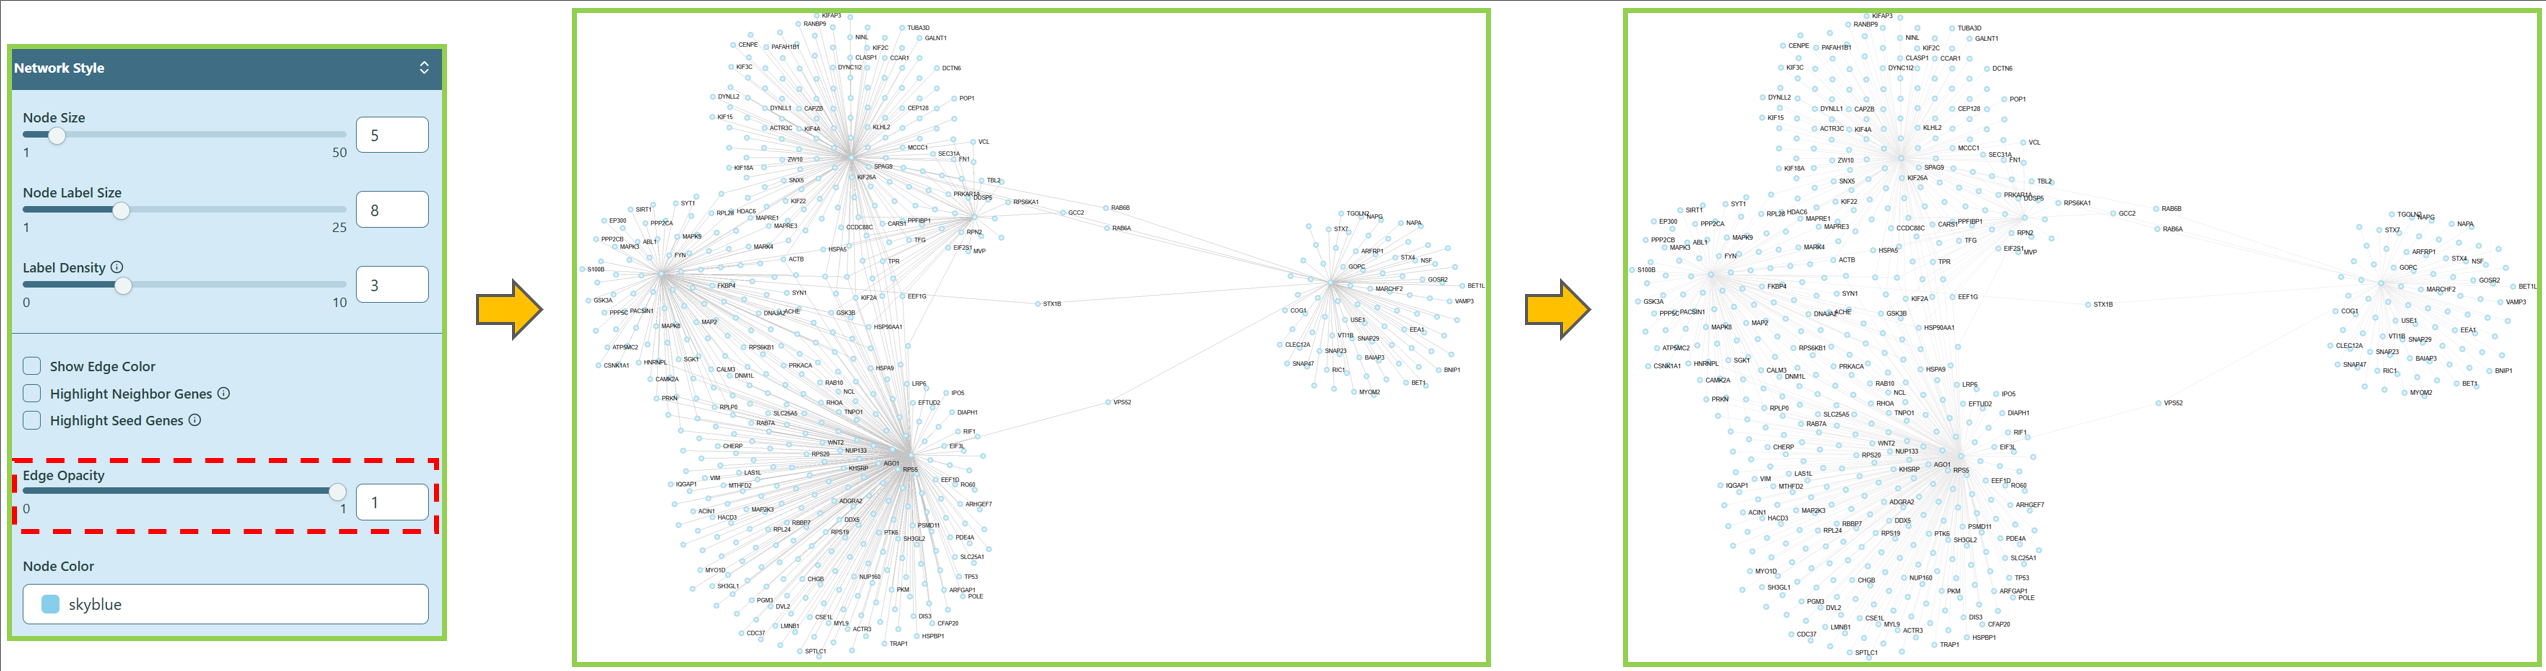 Change Edge Opacity
- Node Color
You can change the node color here, simply by selecting different color or type different color names.
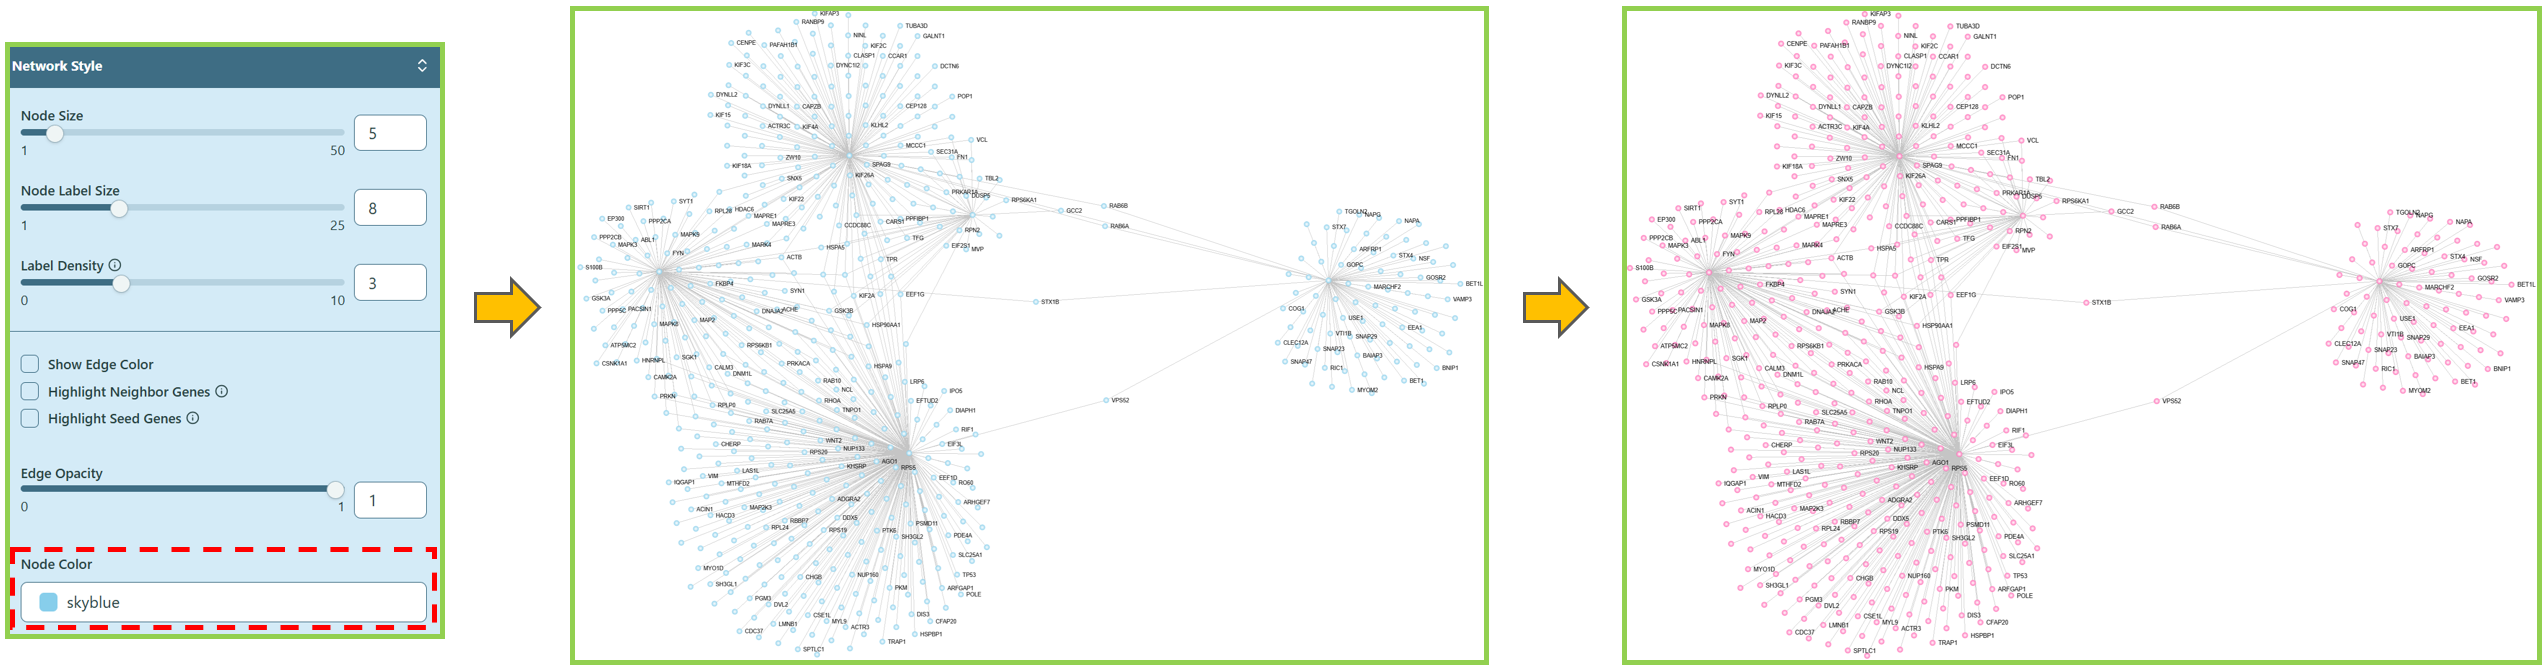 Change Node Color
Network Info
When the network is rendered, the basic information of the network is shown here, i.e. total nodes, total edges.
You can also click Show Details button after selecting the nodes in the network. Please refer to Node Details & GSEA in Network visualization board section for more information.
Legends
You can see the Legend of each feature in Node Color section.
Choose a feature in Node Color section on the Left panel, then navigate to Legends section on the Right panel to get the legend of a specific feature.
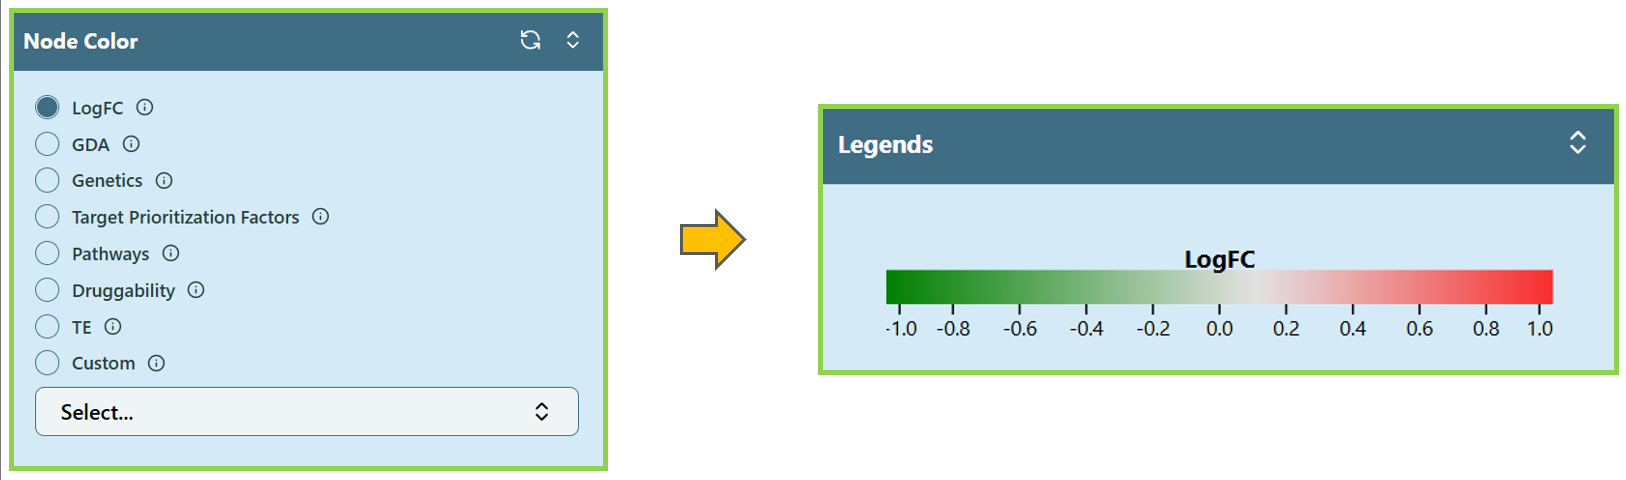 Legends when selecting LogFC in Node Color
Citation
[1] Hao Lu, Mahantesh Halappanavar, Ananth Kalyanaraman, Parallel heuristics for scalable community detection, Parallel Computing, Volume 47, 2015, Pages 19-37, ISSN 0167-8191, doi: 10.1016/j.parco.2015.03.003 .